Cost Management in Azure Using Cost Analysis Tool

Ensuring our applications and system are reliable is one way to promote customer satisfaction. What’s more, consistent speed and efficiency will make your customers come back for more. At a time when there are so many other options for a customer to get a particular service. It’s important that we put our house in order as a company that is hoping to make a profit. Furthermore, metrics and logs can help us with useful insight into the cost and performance of our running application. However, it can become more reliable if we keep a tab on all the metrics that will help us take the necessary action. Want to know more about cost management in Azure? You’re in the right place.
The link to my previous post can be found here: How to install Static pods in Kubernetes, how to create and deliver a report based on system utilization on a Linux-based OS, and how to use container insights to get the full benefits of Azure Monitor for Azure Kubernetes workload.
I will walk you through
- How to use the cost management tool for cost analysis in Azure
- How to create an Analytics workspace in Azure for our test application techDirectArchiveApp.
- How to create a diagnostic setting for the App.
- How to get run/query logs for the application to see what’s happening to our app.
Cost Analysis
Before we proceed, let’s talk a little bit about the robustness of Azure Monitor, according to Microsoft.
Azure Monitor collect, analyze, and act on telemetry data from your Azure and on-premises environments. Azure Monitor helps you maximize the performance and availability of your applications and proactively identify problems in seconds.
In this article, we will be focusing on some rich features of Azure Monitor and how they can help you be wise with your spending and of course make you become more reliable with your application so that your customer stays with you.
These features are part of Azure Monitor
- The Cost Management Tool
- Log Analytics workspace
- Diagnostics Settings
For the cost and optimization of workload in Azure, customers can take full advantage of the Cost Management features of Azure Monitor.
Azure Cost Management + Billing is a suite of tools provided by Microsoft that help you analyze, manage, and optimize the costs of your workloads.
Uses of Azure Cost Management + Billing features:
- Conduct Billing Administrative task such as paying of bills.
- Manage billing access to cost.
- Download cost and usage report.
- Proactively apply data analysis to your cost.
- Set spending threshold.
- Identify opportunities for workload changes that can optimise your spending.
Analyzing Cost Using the Cost Management Tool
Our next point of action is how to review the cost of your workload in cost analysis. Thus, you can do this from the cost management tool in Azure. Then, check how to customize the view, and lastly how to download our cost reports.
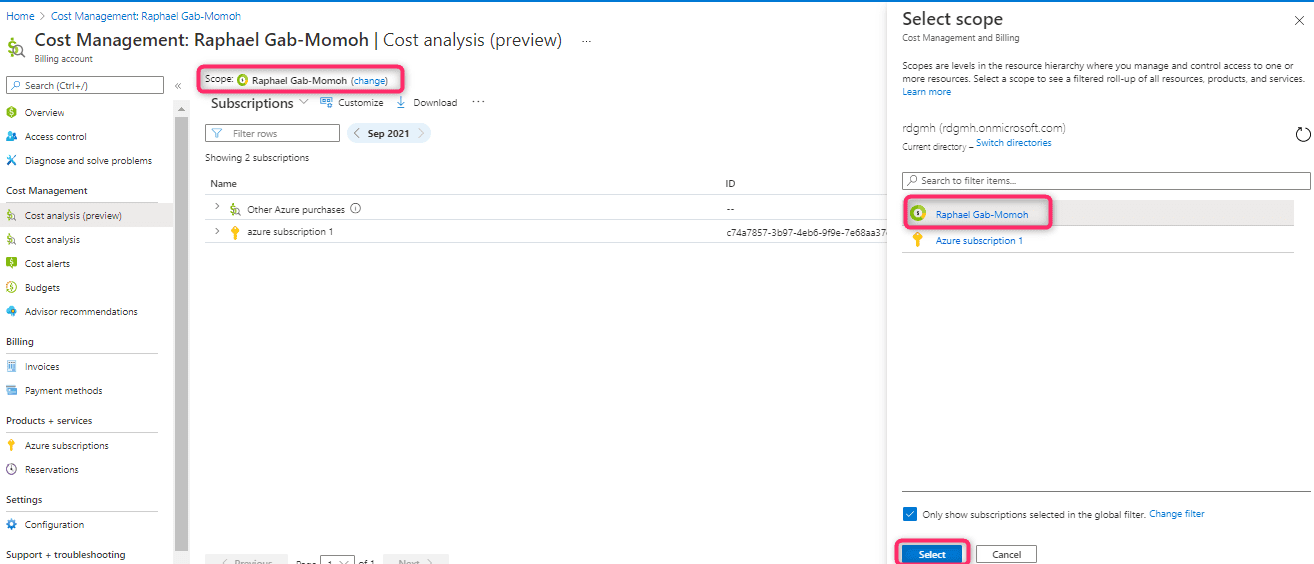
So, to locate the cost management and billing tool, you can search for it on the search bar or from Azure monitor. The Cost Analysis tool is on the left-hand side of the tool in the blue highlight. Hence, to be able to drill down on our cost elements, we need to check the scope.
A scope can be defined at four levels in Azure: management group, subscription, resource group, and resource.
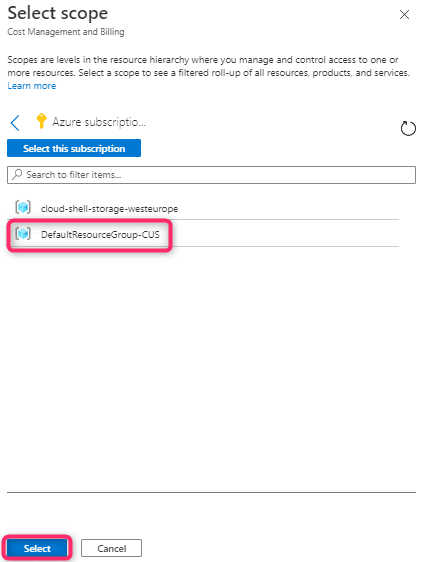
In Fig 2 above, we selected a scope that is at the resource group level, so all our spending at that level is what we want to see and if possible take action on.

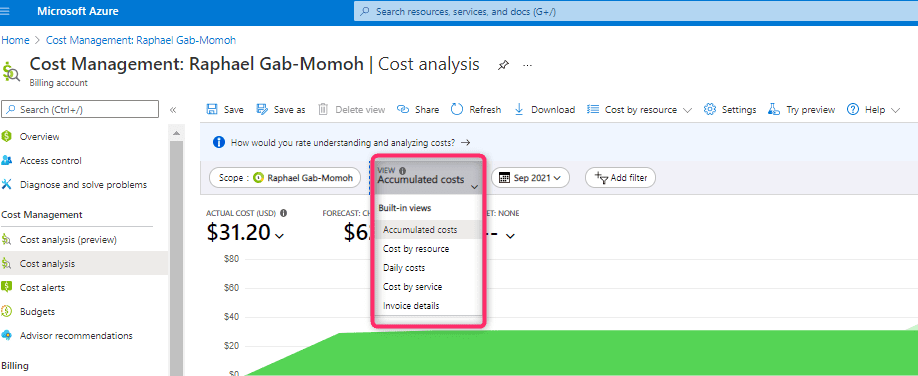
From the cost analysis section of the cost management tool, we can see the accumulated cost, actual cost, forecasted cost and with these, we will be able to make an intelligent cost decision of our cloud expenses.
It’s also very important to note that we can point out our cost by views
If we are to view by cost by resource, a cost analysis will show us the exact resource that made our bill go up or down so that we can take the appropriate action.
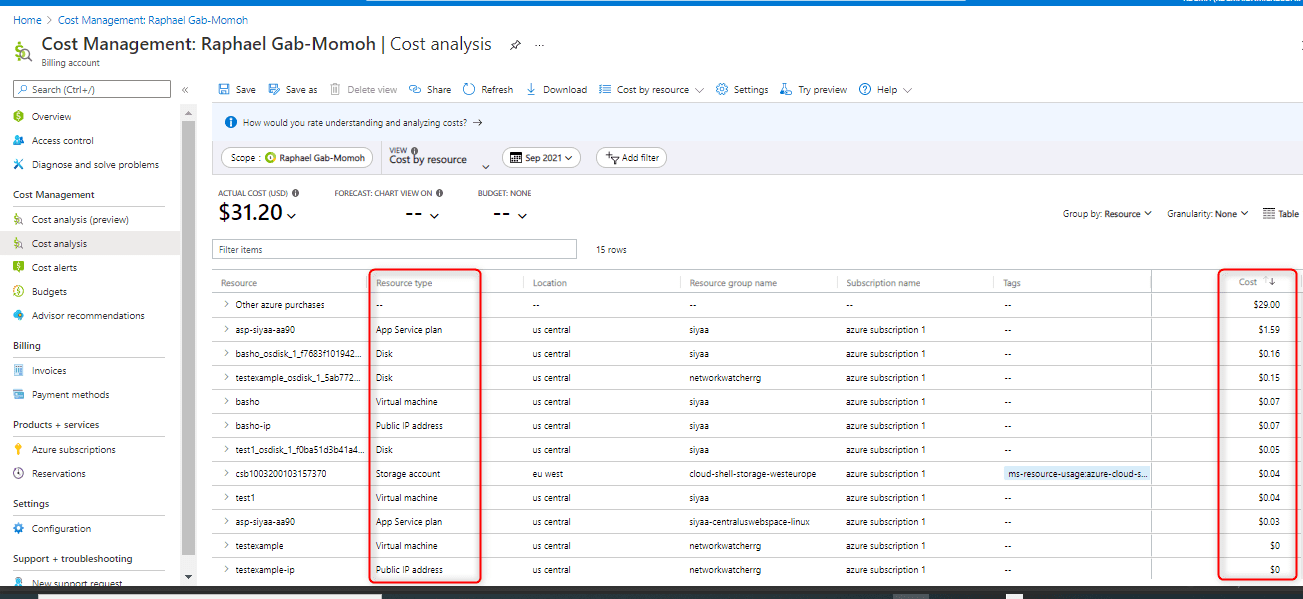
Therefore, we can choose to download any of the cost views as JPG, Excel, or CSV as shown in the red highlight below.

Creating a Log Analytics workspace for Cost Management in Azure
A Log Analytics workspace is a unique environment for Azure Monitor log data. Each workspace has its own data repository and configuration, and data sources and solutions are configured to store their data in a particular workspace.
Collects Data from:
- Azure resources in your subscription
- On-premises computers monitored by System Center Operations Manager
- Device collections from Configuration Manager
- Diagnostics or log data from Azure storage
By default when we create an App we will be given the option to enable application insight and the logs from those insights will need a workspace. Thus, if we don’t have a workspace created for our App, Azure will create one by default. But as a responsible cloud practitioner, it’s good to create one
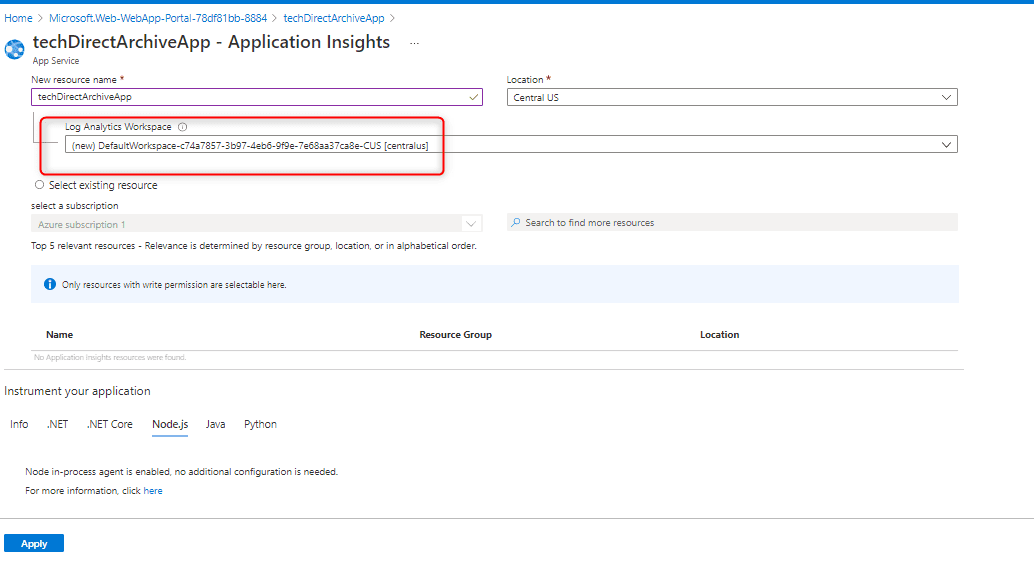
For me, I would normally just type log analytics workspace in the search bar and click to begin creation but it’s usually found in the Azure services section of the portal.
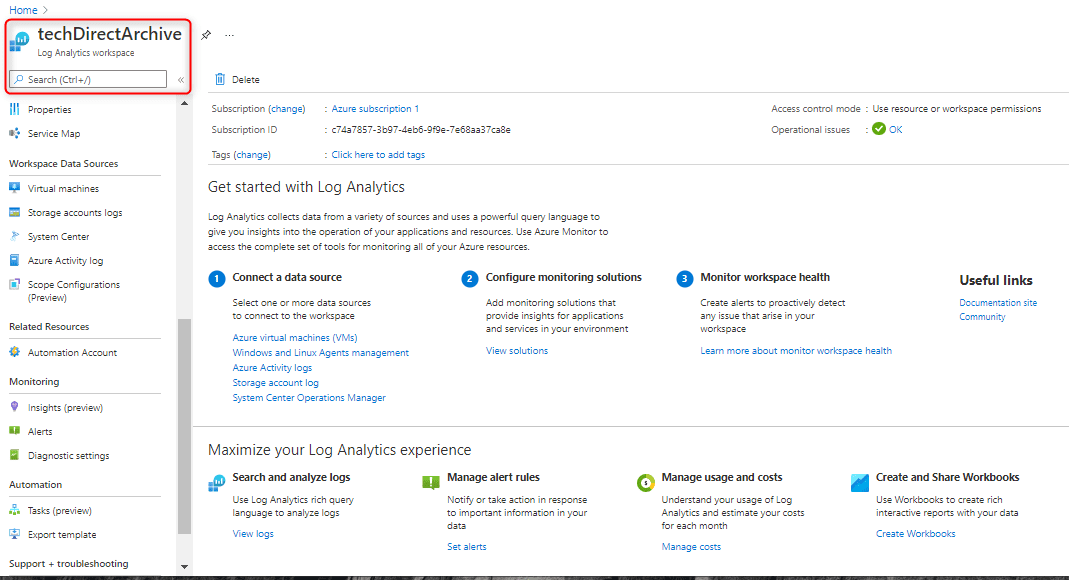
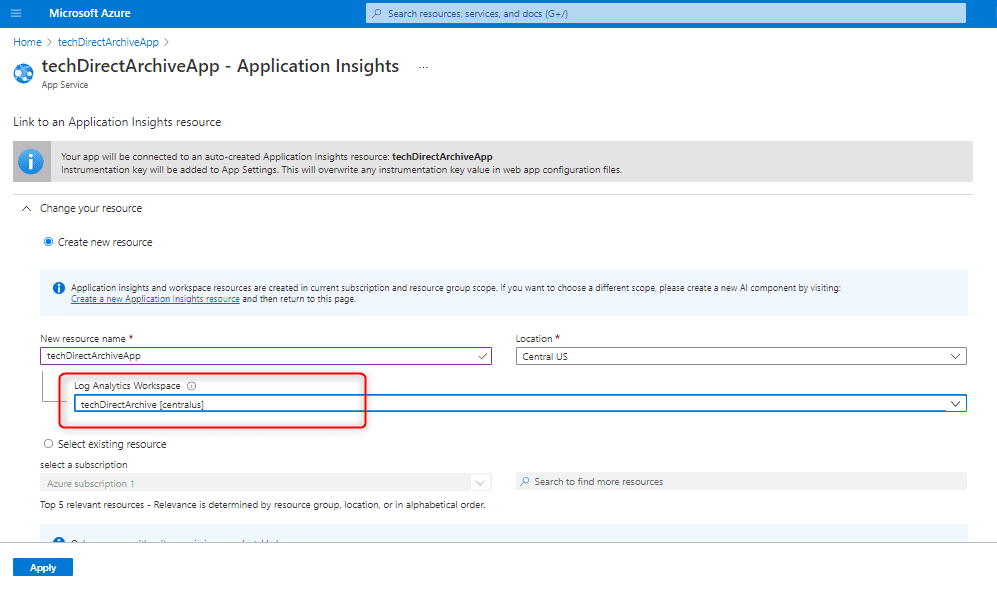
Since the log Analytics workspace name techDirectArcive has been created, it will be good to let the logs from Application Insight for the App techDirectArchiveApp be placed in our newly created workspace as shown below
Diagnostics Settings
While we discussed cost analysis and cost management tool, let’s describe the diagnostics settings. Since, we have our app techDirectArchiveApp sending logs to our workspace, now it’s time to create a diagnostic setting for the app.
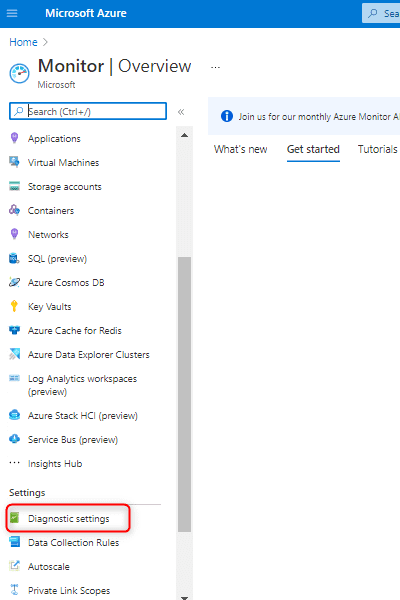
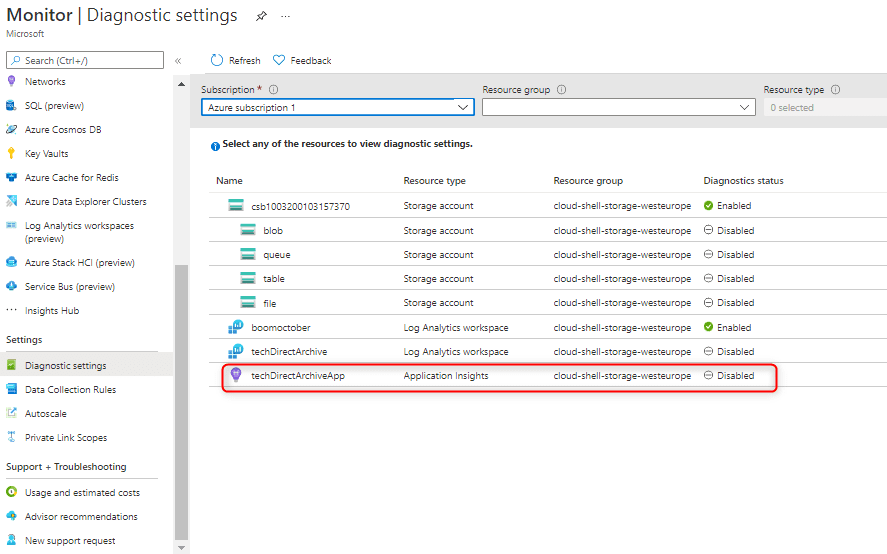
So, to create this we check from the monitor section of our workspace or better yet, we can just go to Azure Monitor and check the settings section just as shown below
When we click on the settings, a list of apps will come up for us to activate or add diagnostic settings upon. We will select our newly created techdirectArchiveApp that was sent to the workspace that we created
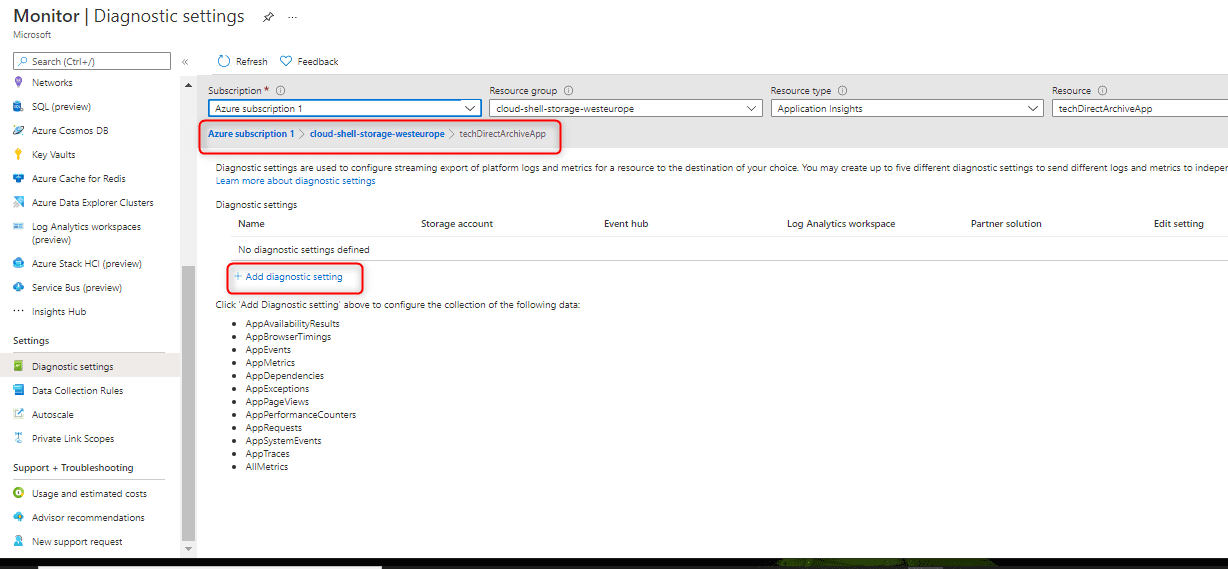
we will select and add diagnostics settings to the app
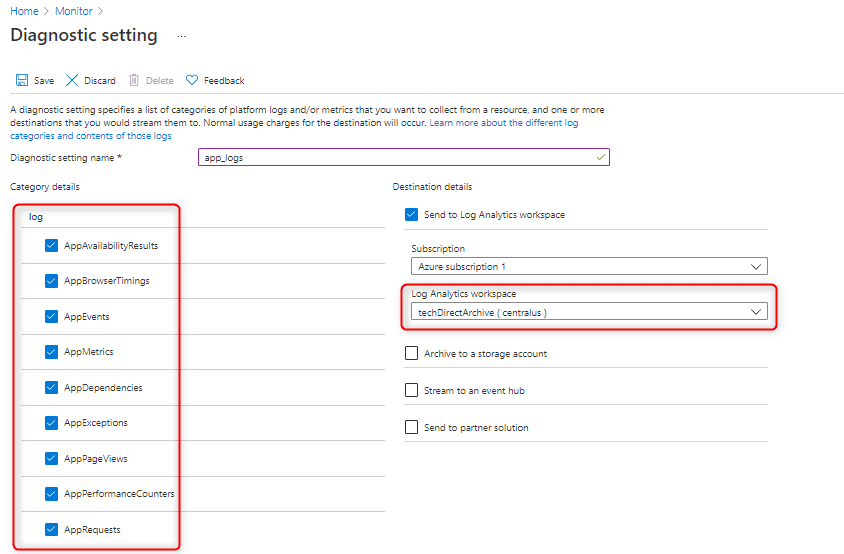
We applied all the categories of logs we want to the settings and requested them to be sent to our created workspace. We named the settings app_logs
Log Query
Log query is crucial to analyzing cost in Azure. We can choose to start from the Azure monitor page but preferably from our created workspace, check for the section with the title logs. It will give us an option that is as shown below
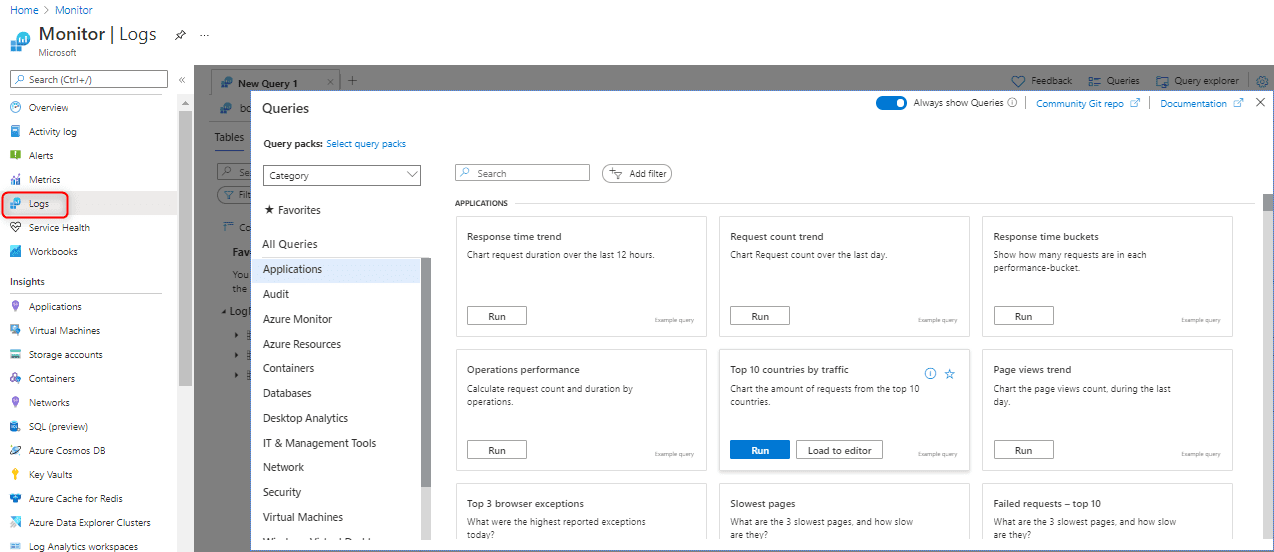
lets hit the run button on the response time trend
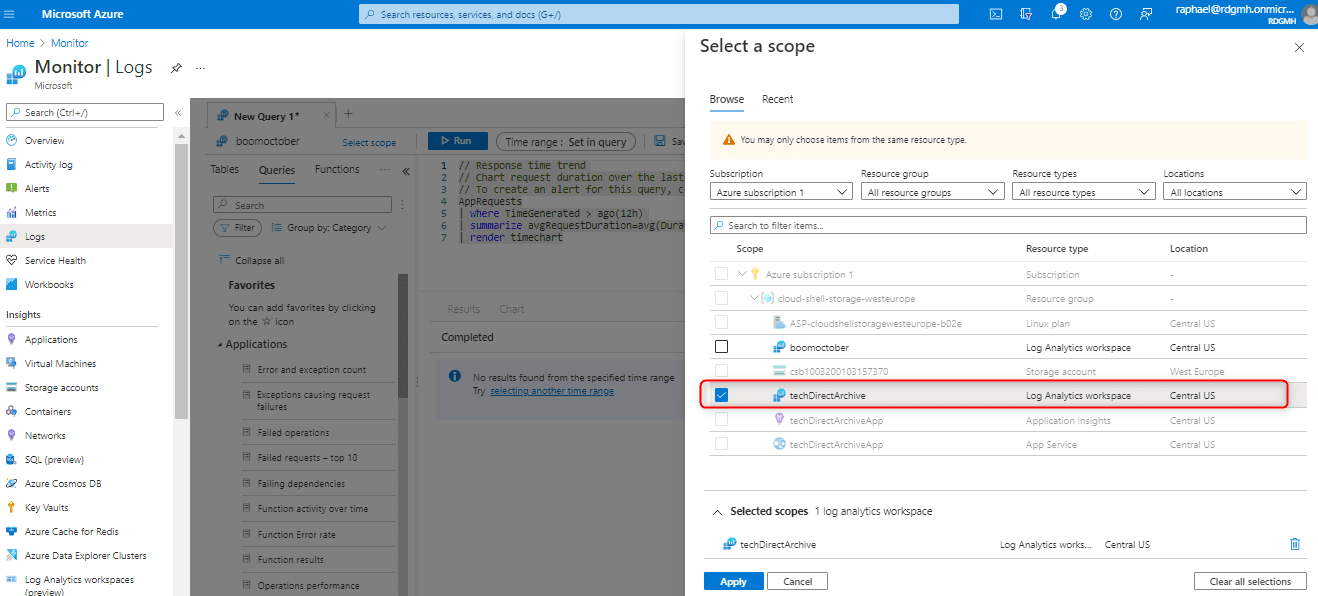
We still need to do a scope as we have other options, the scope will help us narrow down our search on the app we are interested in getting metrics from. In this case, it’s techDirectApp that is in the techDirectArchive log analytics workspace.
If we remember correctly we decided to run a query for response time trend. The result is as shown below. If you followed along, go get a cold glass of juice because the mission has been accomplished as seen below

In Summary, knowing how to use cost analysis provided with the Cost management tool of the Azure portal can help us make smart decisions about our cloud spend. Also in order to make our app more reliable, it is important that we can query logs and check what is happening to our app at each point in time. Log Analytics workspace and diagnostic settings can help us with all the metrics we need to query our app logs.
If you have any questions, leave us a comment and we will answer it. For now, I will see you in the Cloud.


The title of the page implies that you write a LA query (KQL) to analyse the cost of the resource. As you know, that’s not the case. This is a misleading post.