When deploying a production-grade workload, there is the need to make sure that the agent nodes are working the way they should. This is because Azure works to sure that the master node is working well and fine. Nonetheless, our only headache is the agent nodes or worker nodes. In this guide, I will walk you through how to use container insight for Azure Kubernetes , while ensuring our container workload is alright. Kindly refer to these related guides: How to create a static pod in Kubernetes with demos that can help you become a better Kubernetes administrator and how to create and deliver a report on System Utilization on a Linux-based OS.
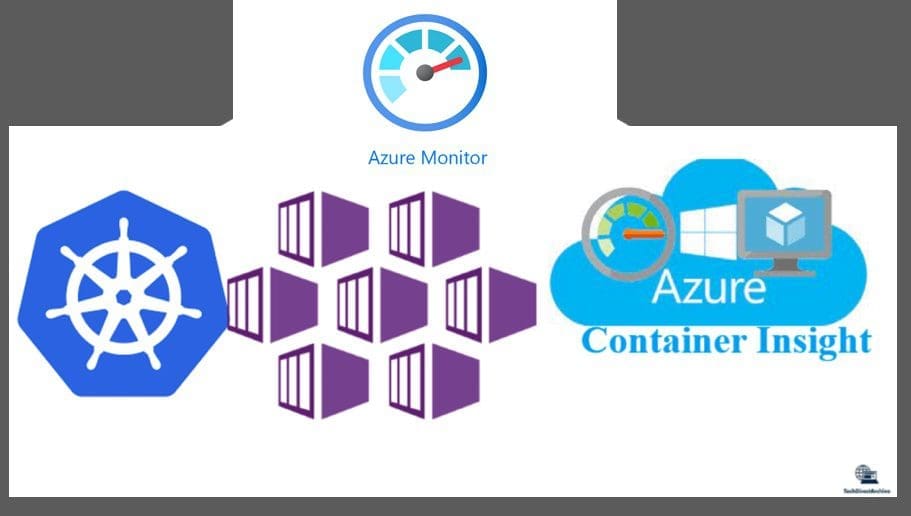
Azure Monitor gathers information from Azure resources, apps, and operating systems. In our example, it collected its data from a special feature in the Azure monitor called container insight. The type of data collected depends on the resource, and it might be a metric, a log, or both, which is then utilized for analysis, visualization, alerts, automation, and other purposes.Container Insight
Container Insight is a feature of Azure monitor that can be used to monitor an Azure Kubernetes workload. Thus, before we proceed, we need to create an AKS cluster. Creating an AKS cluster requires the following:
1. An account set up in portal www.portal.azure.com
2. Azure Cli installed on our local machine you can get the cli from https://docs.microsoft.com/en-us/cli/azure/
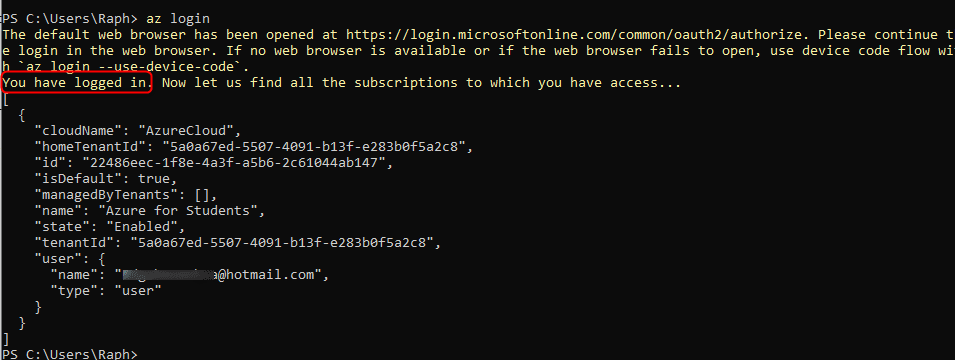
once you log in, you are all set up and start working ( I still use my account from school days because I get free Azure credits with it, so you might want to make good use of your student email from your university days to verify in your usual azure account and you will have the benefits as well )
Steps to create an AKS Cluster
- From your portal locate resources
- click on containers
- Cluster details: we have to make sure that Preset configuration is Standard ($$). you can look at the link for more help Cluster configuration presets in the Azure portal.
- Add Kubernetes cluster name, such as techDirectArchive Cluster
- pick your desired Region and Kubernetes version for the AKS cluster.
- Primary node pool:Leave the default values selected but you should reduce the maximum node count from the default or else you will get an error. When you see a validation passed just as in fig 3 below you are good to go


The completion process might take up to 5 minutes or more

Enable Container Insights for Azure Kubernetes
To access the newly created techDirectArchieve cluster and enable “container insights for Azure Kubernetes,” ensure you follow these steps.
If you’re utilizing PowerShell, verify that you have installed Azure CLI. Alternatively, you can utilize cloud shell on the top right-hand side of the portal. When using cloud shell, remember to mount storage before proceeding
az aks get-credentials --resource-group techdirectarchive --name techDirectArchive
if we inspect the nodes with kubectl get nodes

we have only one as a result of our initial configuration of node-pool. Next, we need to make our application up and running. We need to create an empty manifest file so that we can declare all the parameters that our app will have
vi techdirectarchive-vote.yaml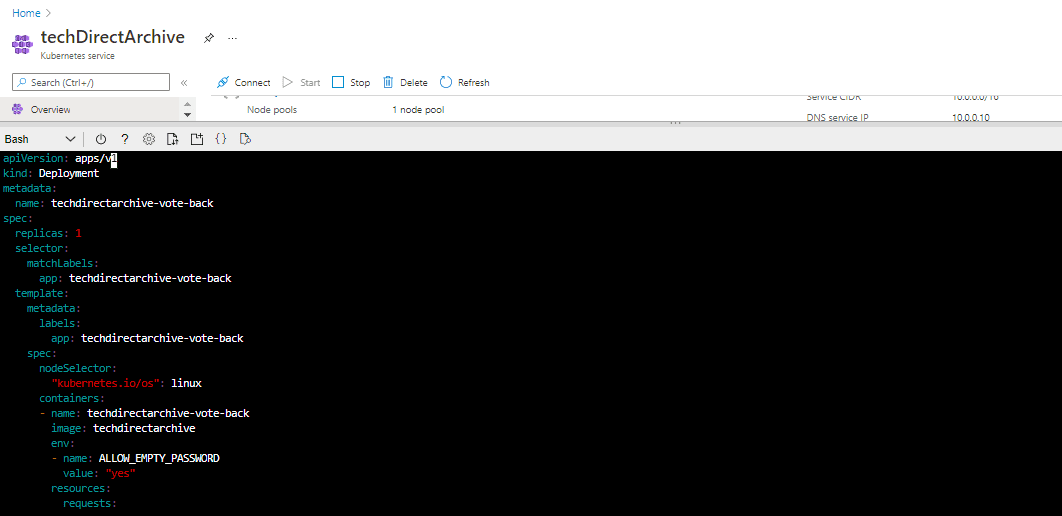
kubectl apply -f techdirectarchive-vote.yaml

As we can see above, we’ve created deployment and service. Before we proceed to use container insight to monitor our application, let’s test it to see if it’s running.
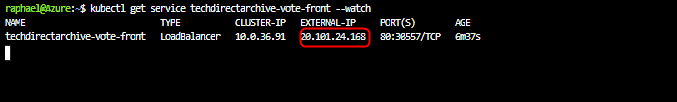
kubectl get service techdirectarchive-vote-front --watchIt returns an external IP address that can be used to display the app on a browser. use CTRL-C to stop the kubectl watch the process and return to the normal prompt
Monitor Containers for Azure
Now that the container is up and running, we will focus on how to use container insight to get metrics about our running container. Container insight gets automatically enable with every running container. To locate the container from insight, follow the guide below
Check Azure Kubernetes resource in Azure portal
look for monitoring and then choose Insights.
At the top, click on + Add Filter.
Select Namespace as the property, then choose <All but kube-system>.
Select Containers to view them.

The performance of workloads deployed in Kubernetes clusters may be monitored using Container Insights. Container insights may display performance by utilizing the Metrics API to collect data from Kubernetes containers. Logs from containers are also collected.
From the image, under the monitoring section on left, click on insights

From the image, click add filter and choose namespace for property for value select <all but kube-system>

Log Analytics for Azure Kubernetes
From the image, at the right-hand side, the view in analytics and open in another window to view logs about the container. From our pod definition file our container was callled azure-vote-back and Azure-vote-front The logs include the stdout and stderr streams from azure-vote-back and azure-vote-front containers.

In Summary, to be able to monitor an AKS workload, first of all, we needed to create the cluster and connected it to it using the resource group name (techdirectarchive)and the cluster name(techDirectArchive).
Next, we created the application( azure-vote-back) in our example using vi editor. When we ran the kubectl apply -f against our pod definition file we got deployment and service as shown in fig 7, showing that the container was successfully created.
Finally, Microsoft Azure Monitor provides a centralized platform for measuring and monitoring the performance of your apps and systems, as well as the resources they use. Custom performance tracking can also be achieved by combining Azure Monitor with a variety of other systems and utilizing custom log queries. Guess by now, you know how to use container insights for Azure Kubernetes.
Cloud resources consume money so please, make sure you have deleted the Kubernetes cluster when you are finally done with practicing along. lastly, please let us know if you found this Azure Kubernetes Cluster and Container Insight guide helpful in the comments section below.


Nice Article, was helpful 🙂
Thank you for your kind words!