System and service monitoring is what Prometheus does. It gathers data from configured targets at predetermined intervals, analyzes rule expressions, presents the findings, and can send alerts when certain circumstances are satisfied. For details on how to install Prometheus please check How to install, configure Prometheus for Monitoring on a Linux Server, and how to Rename or Move Files or Directories in Linux with Bash Terminal.
You will learn How to use Prometheus for Monitoring. Therefore, at the end of this article, you should be able to set your configuration, start Prometheus, use Prometheus’s inbuilt browser and do some real monitoring
Other valuable articles are here: How to Overlay two files with UnionFs in a Linux System and How to install Redis on a Linux System and How to Install Apache Subversion on a Linux System and How to install Rust in a Linux System.
Recall: Install Prometheus
Check this link to install Prometheus: How to install, configure Prometheus for Monitoring on a Linux Server .One of the easiest ways to have Prometheus installed is by launching a docker container. Endeavour to pull Prometheu’s image into your local environment with docker pull prometheus before you run the command if not, you will encounter an error.
docker run --name prometheus -d -p 127.0.0.1:9090:9090 prom/prometheusConfigure Prometheus
You must first build a configuration file for Prometheus before running it. Prometheus gathers metrics from monitored targets by scraping metrics HTTP endpoints on these targets. Prometheus can scrape and keep track of its own health since it exposes data about itself in the same way.
Even if a Prometheus server that simply gathers information about itself is not particularly helpful, it is a nice place to start. Overwrite the currently existing exampleprometheus.yml file by saving the following Prometheus configuration in the current directory as a file called prometheus.yml with the following code:
global:
  scrape_interval:5s
  evaluation_interval:5s
scrape_configs:
  - job_name:'prometheus'
 static_configs:
  - targets:['localhost:9090']
Here is what the default file looks like when you do a vim prometheus.yml

After Overwriting the default, it will look like this

Prometheus is set up in this way to scrape metrics from itself every five seconds. Additionally, recording and alerting rules are configured to be assessed every five seconds, which will be important later. but please note that the only thing that really changed is the scrap interval and evaluation interval.
Prometheus has flag-based configuration parameters in addition to the configuration file. These can be seen by running:
./prometheus -h
Start Prometheus
using our newly constructed configuration file, and launch Prometheus.
./prometheus
At the URl/status, Prometheus should launch and provide statistics about itself. To be able to check the machine IP. Open a new tab and check the IP address with the command
ip addr show
To be able to work directly with Prometheus, let’s open the URL on your machine’s browser.


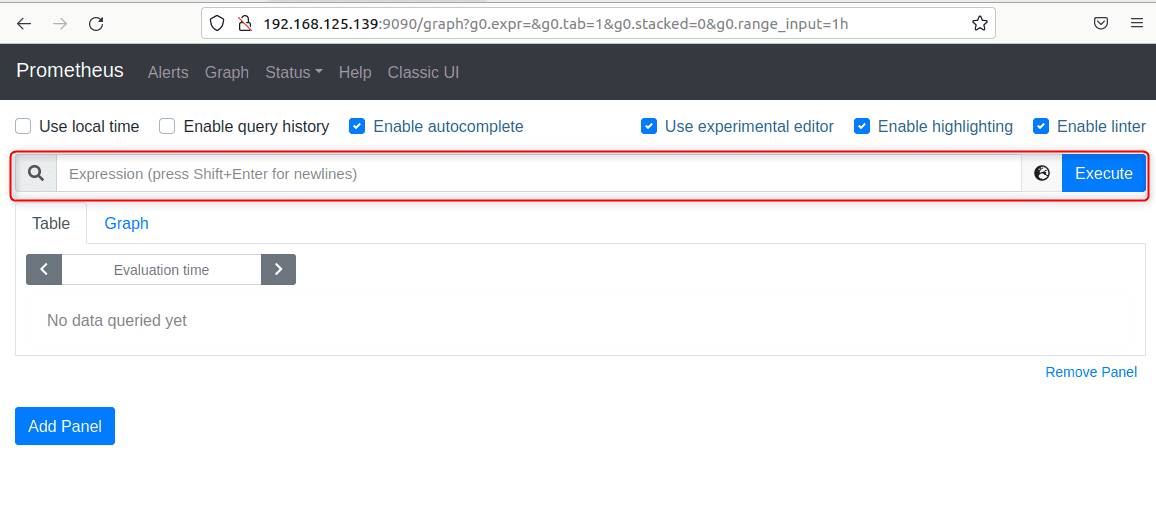
Using Prometheus’s Expression Browser
Let’s run some test queries and explore Prometheus’ built-in expression browser. Go to URL to access the expression browser. Then select the Table view.
Checking the “Use experimental editor” box will enable features like contextual autocomplete, inline linting, and syntax highlighting that will make editing much more comfortable.
The Graph tab illustrates values over time, whereas the Table tab displays the most current value of each output series of an expression. The latter is sometimes pricey (for both the server and the browser).
Generally speaking, it is wise to test out potential expressions on the Table tab first and then switch to the Graph page once an expression has been sufficiently cut down. Let’s spend some time experimenting with the expression browser.
Execute PromQL expression 1: prometheus_tsdb_head_samples_appended_total

shows you the total number of samples ingested into Prometheus’s local storage since the process start time
Execute PromQL expression 2: rate(prometheus_tsdb_head_samples_appended_total[1m])

Shows you the number of samples ingested per second as averaged over a 1-minute window. We can also take a look at the graph view for this

Execute PromQL expression 3 : up{job=”prometheus”}

shows the value of the synthetic up metric for the Prometheus target, which is set to 0 when a scrape fails and to 1 when it succeeds. Prometheus is scraping the target correctly because it shows a value of 1.
Monitoring a Demo Service
In this section, we will try to understand more about querying, we run, monitor, and let Prometheus scrape three instances of a demo service that generates synthetic (artificially generated) metrics.
In a new terminal, change to your home directory and download the demo service:
wgethttps://github.com/juliusv/prometheus_demo_service/releases/download/0.0.4/prometheus_demo_service-0.0.4.linux.amd64.tar.gz
Extract the demo
tar xvfz prometheus_demo_service-0.0.4.linux.amd64.tar.gzRun three background instances of the demo service, each running on a different port:
./prometheus_demo_service -listen-address=:10000 &
./prometheus_demo_service -listen-address=:10001 &
./prometheus_demo_service -listen-address=:10002 &
Each of the instances now serves synthetic metrics about itself on the URL below. Explore the metrics of one instance a bit.
URL/metricsThe demo service generates four different types of
- simulated metrics:
2. Metrics about an HTTP API server (request counts, durations, errors)
3. CPU usage metrics Disk usage and total size metrics
4. Metrics about a batch job that runs periodically and an fail with a certain probability
Add the following list entry to thescrape_configssection in yourprometheus.ymlto makePrometheus scrape the demo service instances
- job_name:'demo'
     static_configs:
       - targets:
       -'localhost:10000'
       -'localhost:10001'
       -'localhost:10002'
Make sure that Prometheus reloads its configuration file:
killall -HUP prometheus
Selecting Series
We must understand how to select series data from the TSDB before you can perform any more helpful tasks with PromQL. Asking for all series with a particular metric name is the simplest method to accomplish this. Simply the metric name itself is the query for this.Here is an example:
demo_api_request_duration_seconds_count
Note:The demo_api_request_duration_seconds_count metric is a counter that tells you the total number of handled API requests. The reason why it awkwardly includes request_duration_seconds in its name is that it is created as a by-product of a histogram tracking request durations with the base name demo_api_request_durations_seconds.
We can add filter criteria depending on the label values of each series to reduce the number of series you need to choose. As an illustration, the following query only chooses queries that had the HTTP status code 200.
demo_api_request_duration_seconds_count{method="GET",status="200"}
Set Up Grafana
The built-in graphing mode and expression browser in Prometheus are helpful for on-the-spot debugging, but they are not a strong option for persistent and shareable dashboards or more complicated graph options.
You will discover how to build dashboards with Prometheus data in this section of the article. Grafana has a variety of deployment and configuration options, as well as the ability to store dashboard metadata using several backends.
You will run Grafana on Docker using the default configuration parameters to make things easy. To run Grafana on Docker on port 3000, run:
docker run -d -p 3000:3000 --name grafana grafana/grafana:7.5.4
Enter the default username and password, admin as shown below to log in.

When prompted for a username and password, enter the username and password as admin or any that you can easily remember.
Please see how to Rename or Move a File or Directory in Linux – Bash Terminal Command, Error – kinit: KDC reply did not match expectations while getting initial credentials, and how to disable Outlook and Yahoo Auto-Complete.
Create a Prometheus Datasource
Before you can build a dashboard, you must configure a Grafana data source that can access Prometheus. Lets follow the steps to configure
- Click on Add your first data source in the Home view after login
- Choose “Prometheus” as a datasource type
- Fill out the data source field
- Enter Demo Prometheus into the Name field
- Set the URL
- Leave the other fields at their defaults
Click Save and Test and verify that the data source was saved and tested successfully

Make sure that after clicking on save and test you do not see an error and it can show green that the data source is working like what you see in the image below

Please see Install Grafana on Windows and Windows Server, How to install Grafana on Ubuntu Linux, and How to Analyse Performance and Diagnostics in Microsoft Cloud with Azure Monitor.
Create a Dashboard
Now we can create our first Grafana dashboard:1: Click on the+(Create) icon in the left menu, which takes you to an empty new dashboard.

2. Click on Add an empty pane lto add a new graph panel to the dashboard.

3. Set the time range (at the top right of the graphpanel) toLast 1 hour.

4. Enter the following expression into the query expressionfield (with the placeholder text “Enter a PromQL query”):
sum without(instance, status)(rate(demo_api_request_duration_seconds_count{job="demo"}[1m]))This graphs the demo service HTTP request rate, aggregated over all instances and response status codes
5. Set the Legendfield to{{path}}: {{method}}to display briefer legend strings that only contain the label values that are actually relevant to the displayed result.
6. In the panel settings on the right, set the Panel Title field toRequests [rate-1m]7. Click Save at the top to save the dashboard underthe name Demo Service
Grafana dashboard has now been produced using information from Prometheus. It ought to resemble something like this:

Summary of Prometheus for Monitoring
If you follow along, you will be able to install and configure Prometheus along with demo services and finally be able to set up Grafana to use what you configured in Prometheus for a dashboard.
I hope you found this article useful on how to use Prometheus for Monitoring. If you have some questions, kindly let me know in the comment session.