
When we’re attempting to figure out what’s going on with our server so we can debug it, having helpful information about the system’s memory status, mount points, and all running processes can help us narrow down the problem. Our purpose here is to check out how our system is doing and report what we get. When it comes to reporting in the field of IT, especially for System Administrators, the method is different. Typically, the requirement for a new device is dependent on what a system reports. As a result, adding this to our skill set is critical. This article explains how to create and deliver report on system utilization.
Kindly refer to some of my guides: How to use container insights to get the full benefits of Azure Monitor for Azure Kubernetes workload, and how to create a static pod in Kubernetes with demos that can help you become a better Kubernetes administrator.
In this guide, I will walk you through how to create:
- A memory report using various memory commands
- A system storage report
- A list of running processes .
Requirements for checking and delivering report on System Utilization
Thus, to create and deliver report on system utilization using Linux, we will need a few things.
1.Command line interface or Terminal
2.A user with root Privileges
3.Package Manager apt for linux or  yum for centos depending on the distro you have
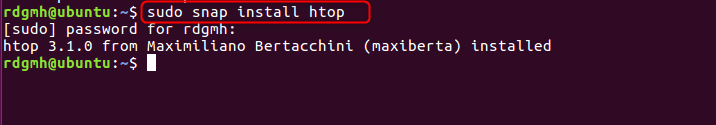
The commands in this guide will work regardless of the Linux distribution you’re using. However, if you’re using an Ubuntu-based distribution, you may need to use sudo snap install to install some of the commands for the task in this guide. Here is the format for installing a snap sudo snap install <command name>. In addition, snaps are software packages that are containerized and can operate on any system.
How to check memory utilization in Linux
By default, Linux allows us to examine memory information through /proc/meminfo, but the output can be overwhelming and challenging to interpret. However, we can use certain options to create and deliver a more readable report on system utilization.
Therefore, some important options that can be used with memory command include
Options Result
-b output in bytes
– k output in kilobytes
– m output in megabytes
– g output in gigabytes
– l detailed low and high memory statistics
– o old format (no -/+buffers/cache line)
– t total for RAM + swap
– s update every [delay] seconds
– c update [count] times
Also, we need to take note that the result of a process can be redirected into a file using >
The cat command helps to view the content of a file. If we are to view the default memory information on our machine, we would use the command below
cat /proc/memfile
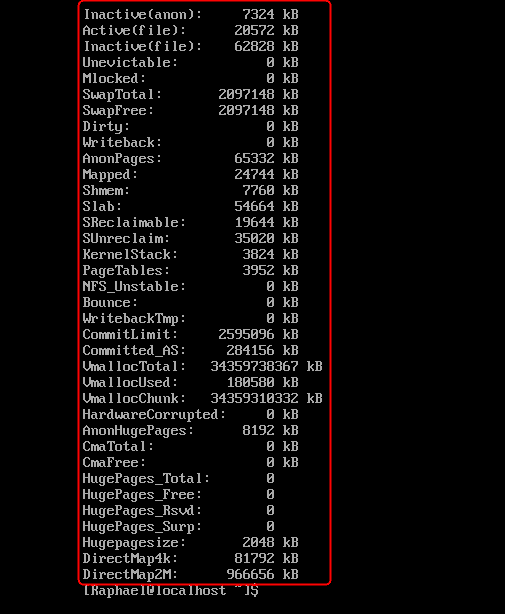
The content of the image above is really not properly defined and hard to decipher with regards to memory but it is the default, lets try this again with another command called :
Free
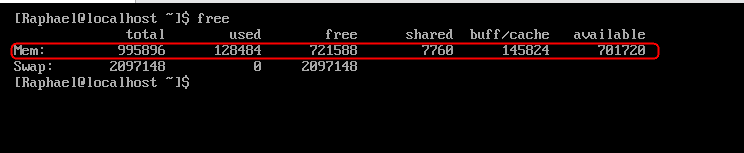
To make this a little more friendly to the human eye and readable as well, we need to add two more options -g (gigabyte) and h (human-readable)
free -gh
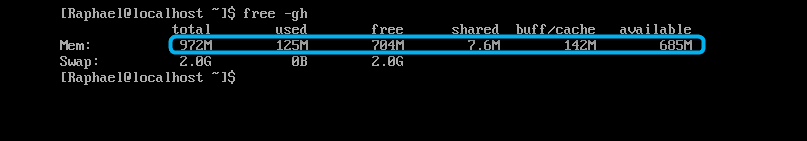
If we compare fig 3 to fig 4 we will notice that the size is more relatable and also we have M appended to it. That is what the options have helped us to accomplish
Delivery of the Report on System Utilization
In Linux, we can send or redirect requested information into files. Therefore, to create and deliver a report on system utilization, let’s create a file to redirect the output of our memory information.
touch techDirectArchive
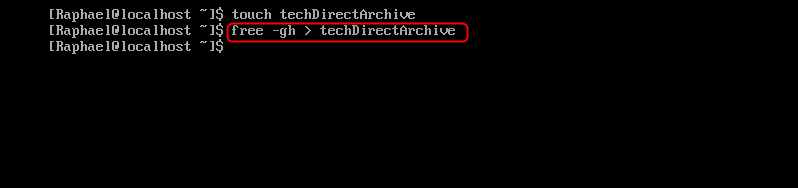
In the case of our example above where we have decided to check what memory resources were being utilized on the system, we can create a file using the touch command and redirect the required memory information to the file as we can see in fig 5
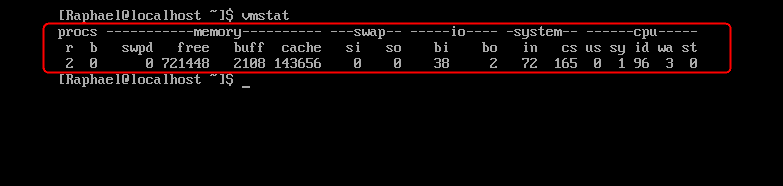
We’ve achieved our first objective. However, there are other commands about memory that we might want to check out. The first one is vmstat
vmstat displays information about processes, memory,block IO, system, and CPU activity.
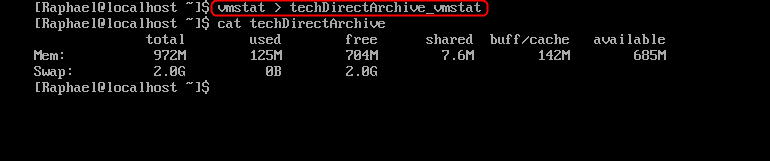
To deliver the report on vmstat, we have to redirect the output of this process to a file called techdirectArchive_vmstat, then we need to create the file with the touch command just as in the techDirectArchive file above
touch techDirectArchive_vmstat
There are instances when all we want to observe is the CPU and Memory utilization, in which case the top command is the best solution. The advantage of the top command is that its numbers are updated in real-time.
top
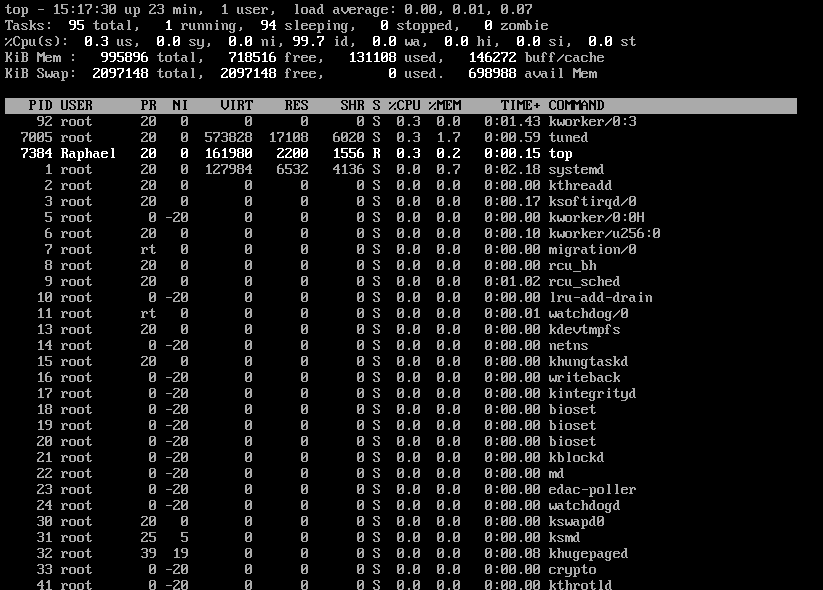
Afterward, you need to hit q on your keyboard to be able to escape from the top session. The cool thing about top is that we can use command-line options to manipulate it.
Collect System Utilization Data
For creating and delivering a report on system utilization, consider using htop as our last memory-related command. Compared to the top command, htop offers a more user-friendly graphical interface and better control, displaying the following information.
- uptime
- average load
- tasks running
- number of users logged in
- number of CPUs/CPU utilization
- memory/swap system processes
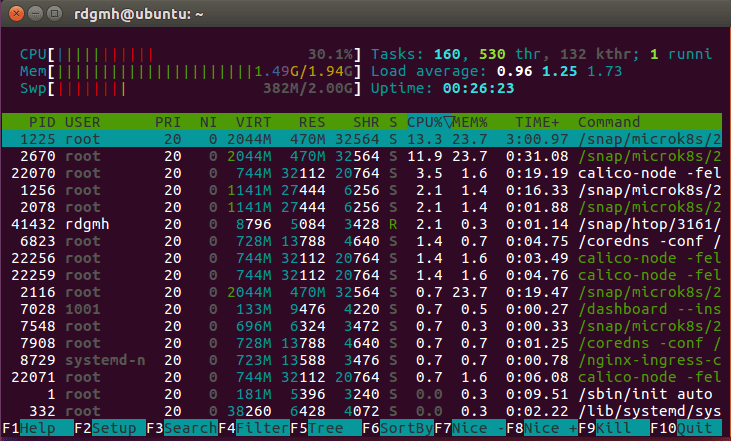
We decided to run the htop command on ubuntu and as you can see it looks more appealing than the output of the top command.
System Storage Report
System storage in Linux has to do with disk usage and we can get the mount points and the usage statics with the command :
df
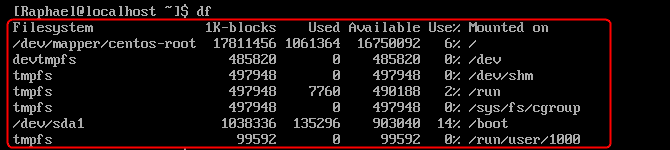
This command shows a list of all the mount points on the system and also the available and used up spaces. Thus, to make this human-readable we need to add the options of -h
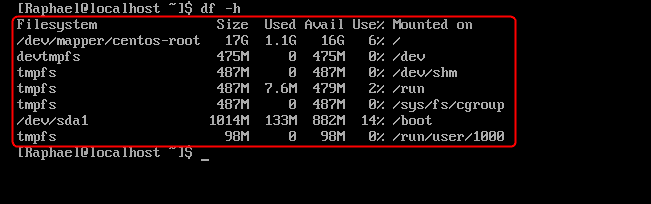
If we noticed the sizes are easier to read with the first one /dev/mapper/centos-report as 17G. 1.6G used and 16G available. So, if we compare this to what we have in fig.10 fig 11 is more relatable
if we are to send a report to the file techDirectArchive_df we will use the command
df -h > techDirectArchive
So, to view the content of our report that was sent to techDirectArchive_df, we need to use the cat command
cat techDirecTArchive_df

Running Processes Report
To create and deliver a report on system utilization, you can utilize the process status in Linux. This command allows you to view processes running in Linux. Hence, the command for this is shown below.
ps
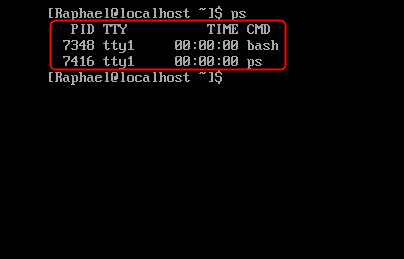
ps aux
Furthermore, the aux option added to the ps command will help to display all the extra parameters need to understand a system fully well.
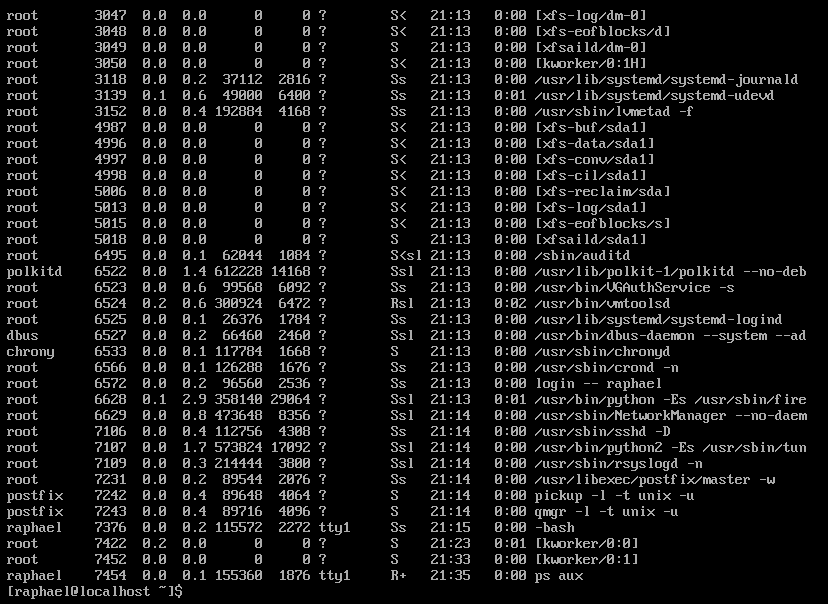
Other comparable options display fewer helpful information than the ps aux command. The UID section, for instance, is replaced with a human-readable username column.
Summary
Memory command like free with option can help us get useful information about swap and memory statics of our server, however, we there are also other useful commands like vmstats, top, and htop. When we are sending a memory command as a report, we need to redirect it to a file.
Mounts on a system can be checked using the df command adding options that will make it more human-readable. Finally, the process status command ps can be used to give a list of all running processes on a system, however, to make it richer we can add aux to it. We guess you know how to create and deliver report on system utilization.


