
In this piece, we shall discuss the steps to install EFK Stack Installation on Docker. Log monitoring and analysis are important for all applications and server or container infrastructure. Elasticsearch, Fluentd, and Kibana (EFK stack) are three of the most popular software stacks for log analysis and monitoring. Hence, the EFK stack is a distributed and scalable search engine that supports structured search and analytics. Please see How to setup and configure a Lamp stack on CentOS.
In this article, you’ll also learn how to use Docker to set up and configure EFK stack log monitoring and centralize container logs to the EFK stack. Meanwhile, in the demo, we use Docker Compose to set up multiple containers.
But first, let's go over what Elasticsearch, Fluentd, and Kibana are. You may also like how to add an EBS volume to AWS EC2 via the AWS Console and CLI, and how to fix “This PC Can’t Run Windows 11” on Hyper V.
Elasticsearch
Elasticsearch is a search engine that uses the Lucene library as its foundation. Thus, it offers a distributed, multi-tenant full-text search engine with an HTTP web interface and schema-free JSON documents.
Kibana
Kibana is an open-source Elasticsearch data visualization dashboard. Besides the content indexed on an Elasticsearch cluster, it provides visualization capabilities. On top of large amounts of data, users can create bar, line, and scatter plots, as well as pie charts and maps.
Fluentd
Fluentd is a cross-platform open-source data collection software project created by Treasure Data. Furthermore, it is primarily written in the Ruby programming language.
Please see how to unregister a GitLab Runner, How to Install and Configure Elasticsearch on Linux, and how to Configure Azure Monitor for VMs on Azure Stack Hub.
Prerequisite to Installing Elasticsearch, Fluentd and Kibana (EFK)
This tutorial includes a hands-on demonstration. To follow along, make sure you have the following items on hand:
- A Linux server – Here, we use the Ubuntu 20.04.3 LTS focal server
- A Docker CE (Community Edition) and Docker Compose are installed on your Linux server.
Setting up an EFK Stack Project
EFK Stack is a log aggregation and analysis framework for bare-metal and container infrastructure. However, before you can deploy an EFK stack, you must first create a project directory and a Docker configuration for deploying an EFK stack on your Docker host.
In this example, you’ll use Docker images that meet the following requirements:
- Elasticsearch 7.17.0 – Capable of storing data at lightning speed. Search capabilities based on Apache Lucene
- Kibana 7.17.0 is an open-source data aggregation and collector that supports JSON data, as well as
- Fluentd Custom image based on v1.14.1 – Elasticsearch data visualization software.
Steps to EFK Stack Installation on Docker (set the EFK stack)
Step 1 – Open a terminal and log in to your Linux server.
Step 2 – Run the following commands to ensure the installation of Docker and Docker Compose on your system.

As you can see from the screenshot above, I have Docker CE (Community Edition) v20.10.7 and the Docker Compose v1.25.0 installed on the Linux Server.
Step 3 – Create a new project directory called efkstack using the mkdir command and make it the working directory (cd).

You can name the directory whatever you want, but as shown above, in this tutorial, it’s called efkstack. This directory stores all the EFK Stack configuration files in this tutorial.
Step 4 – Now, using your preferred editor, create a new configuration file (docker-compose.yml) and populate the following configurations.
The configuration below defines all EFK stack containers using the Docker Compose script v3.
version: "3"
services:
  elasticsearch:
    image: amazon/opendistro-for-elasticsearch:1.3.0
    container_name: elasticsearch
    restart: always
    environment:
      - cluster.name=elasticsearch
      - node.name=elasticsearch
      - discovery.seed_hosts=elasticsearch
      - cluster.initial_master_nodes=elasticsearch
      - bootstrap.memory_lock=true # along with the memlock settings below, disables swapping
      - "ES_JAVA_OPTS=-Xms512m -Xmx512m" # minimum and maximum Java heap size, recommend setting both to 50% of system RAM
      - opendistro_security.ssl.http.enabled=false
    ulimits:
      memlock:
        soft: -1
        hard: -1
      nofile:
        soft: 262144 # maximum number of open files for the Elasticsearch user, set to at least 65536 on modern systems
        hard: 262144
    volumes:
      - elasticsearch:/usr/share/elasticsearch/data
    ports:
      - 9200:9200
      - 9600:9600 # required for Performance Analyzer
    networks:
      - traefik-net
  kibana:
    image: yashlogic/amazon-opendistro-for-elasticsearch-kibana-logtrail:1.3.0
    container_name: kibana
    restart: always
    ports:
      - 5601:5601
    expose:
      - "5601"
    environment:
      ELASTICSEARCH_URL: http://elasticsearch:9200
      ELASTICSEARCH_HOSTS: http://elasticsearch:9200
    networks:
      - traefik-net
  fluentd:
    build: ./fluentd
    volumes:
      - ./fluentd/conf:/fluentd/etc
    links:
      - "elasticsearch"
    restart: always
    container_name: fluentd
    ports:
      - "24224:24224"
      - "24224:24224/udp"
    networks:
      - traefik-net
volumes:
  elasticsearch:
networks:
  traefik-net:
Step 5 – Run the below command to create a new directory fluentd and navigate to that directory. Furthermore, the fluentd directory will store fluentd service configurations.
mkdir -p fluentd/; cd fluentd/Step 6 – Create a new Dockerfile in the ~/efkstack/fluentd directory using your preferred editor (here I’m using the vim editor) and populate it with the following configuration.
In addition, this configuration produces the fluentd custom image, which includes the elasticsearch client driver and the fluentd-plugin-elasticsearch.
# fluentd/Dockerfile
FROM fluent/fluentd:v1.6-debian-1
USER root
RUN ["gem", "install", "fluent-plugin-elasticsearch", "--no-document", "--version", "3.5.2"]
USER fluent
Step 7 – Run the below command to create a new directory conf under the ~/efkstack/fluentd directory.
mkdir -p conf
Step 8 – Now, create a Fluentd configuration (conf/fluentd.conf) using your preferred editor and input the following below configuration. The Fluentd container service can now receive log messages and forward them to the Elasticsearch container service.
# fluentd/conf/fluentd.conf
<source>
  @type forward
  port 24224
  bind 0.0.0.0
</source>
<match *.**>
  @type copy
  <store>
    @type elasticsearch_dynamic
    hosts elasticsearch:9200
    user admin
    password admin
    include_tag_key true
    type_name access_log
    tag_key @log_name
    flush_interval 10s
    include_timestamp true
    index_name ${tag_parts[0]}
  </store>
  <store>
    @type stdout
  </store>
  <buffer tag>
    @type memory # or file
    flush_thread_count 4
  </buffer>
</match>
Inspect the Structure of the EFK Stack
Finally, run the commands below to inspect the structure of the EFK Stack project directory. Before you can view the structure of the EFK stack project, run the sudo apt install tree -y command to install the tree command.
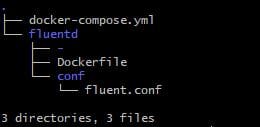
As you can see from the above screenshot, we have established the tree structure of the EFK stack project.
ls - Checking list of files and directory
tree - Checking directory structure
Deploying EFK Stack with Docker
We have now created and set up all of the configuration files required for deploying the EFK Stack with Docker and Docker Compose. The next step is to deploy the EFK Stack using the docker-compose command, which will execute in your project directory (/efk).
Step 1 – First, navigate to theefk project working directory with the below command.
cd ~/efkstack/Step 2 – Next, run the docker-composecommand below to deploy (up) the EFK Stack log analysis and log monitoring system.
docker-compose up -dThe above command will download the Docker images, Elasticsearch and Kibana for you. The Fluentd Docker image is built automatically using the Dockerfile in the fluentd directory. Deployment may take some time, depending on the Docker host’s specifications.
The screenshot below shows the build process for the Fluentd Docker image.

Next is the screenshot showing the deployment is complete, and the Kibana container service is running.

Next, check the logs of the EFK stack build process by running each of the commands listed below. Run these commands whenever you encounter an error during the deployment process.
# Checking logs for service fluentd
docker-compose logs fluentd
# Checking logs for service kibana
docker-compose logs kibana
Finally, the Elasticsearch, Fluentd and Kibana (EFK) stack is completed; now you can run the docker ps command to verify that the three (3) containers are up and running.
I hope you found this article useful on how to install EFK Stack Installation on Docker ( Elasticsearch, Fluentd, and Kibana (EFK stack)). Please feel free to leave a comment below.


I ran through this tutorial which was great because I need to know this for a job Im applying for but it would be great to have a follow up tutorial that says – and now you have this – this is how you use it.
A great point to be considered. We will include a guide on how to use it in the future.