Azure Monitor is a platform service that provides a single source for monitoring Azure resources. With Azure Monitor, you can visualize, query, route, archive, and otherwise take action on the metrics and logs coming from resources in Azure. Azure Stack Hub has built-in Azure Monitor capabilities; however, they are limited. Therefore, if you are looking for a more feature-rich solution, you should use public Azure Monitor. Virtual Metric announces the newest addition to its infrastructure monitoring suite. In this article, we will discuss how to Configure Azure Monitor for VMs on Azure Stack Hub. Please see How to delete your Slack account, how to Leave a Slack Workspace temporarily: How to deactivate a Slack Workspace.
To complete the steps in this article, you must have appropriate access to a subscription in the Azure and Azure Stack Hub portals. You can as well refer to some of the related guides. How to configuring azure monitor for vms on azure stack hub, how to configure vm update management on azure stack hub, how to create a load balancer for azure stack hub, how to install and configure Ansible on Ubuntu, how to install Ansible on Windows with Cygwin, how to automate infrastructure deployments in the cloud with ansible and azure pipelines, how to install Kerberos packages in Windows via Cygwin, how to configure a remote server (windows) to Support Ansible, and how to deploy azure vmware solution private cloud.
Microsoft Azure Stack HCI Monitoring
With the Azure Stack HCI monitoring and reporting tool within VirtualMetric, you can collect, visualize into charts and analyze a wide variety of counters and statistics from your environment. This includes virtual machines on-premise and within the cloud, Windows servers, resources, performance, and more. Like in this article, the Azure Stack HCI monitoring software is completely agentless and delivers features like dashboards, dashboards playlists, smart recursive alarms and notifications, inventory collection, and full customization of all reports inside.
The advanced Microsoft Azure Stack HCI observability solution can be easily integrated within your infrastructure and you can start to collect metrics from physical infrastructure and virtual machines within minutes. Therefore, I’ll be explaining how to utilize public Azure Monitor with Azure Stack Hub instead of the built-in Azure Monitor.
Enabling Azure Monitor for VM Insights
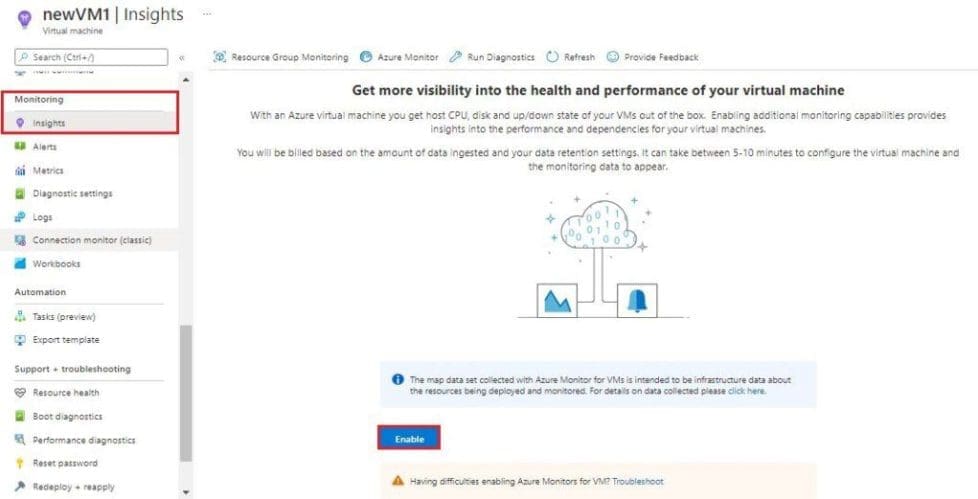
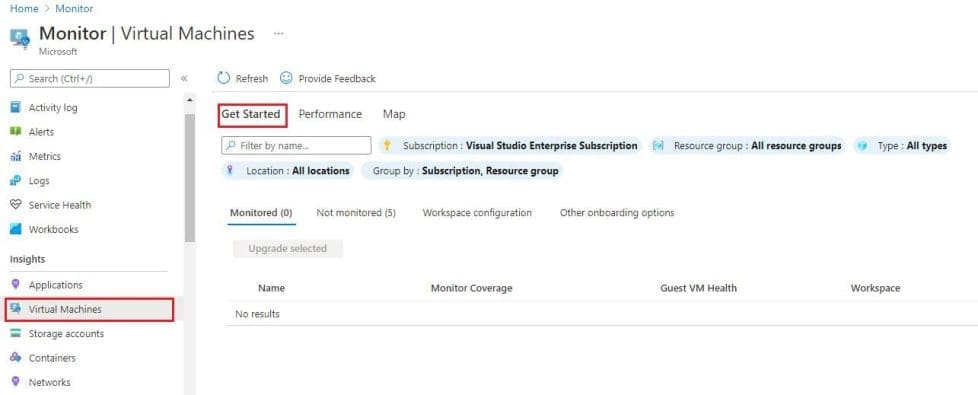
From the Azure portal, select Virtual machines, Virtual machine scale sets, or Servers – Azure Arc. Next, select a resource from the list. In the Monitoring section of the menu, select Insights and then Enable. The following example shows an Azure virtual machine, but the menu is similar for Azure virtual machine scale set or Azure Arc.
- From the Azure portal,
- Select Virtual machines -> select a VM resource created on the list
- In the Monitoring section of the menu -> select Insights -> then Enable.
Creating the Log Analytics Workspace
A Log Analytics Workspace is an Azure resource and a container where data is collected, aggregated, and serves as an administrative boundary.
Creating an Azure Monitor Log Analytics workspace has some specific considerations you need to account for before choosing to create a new workspace.
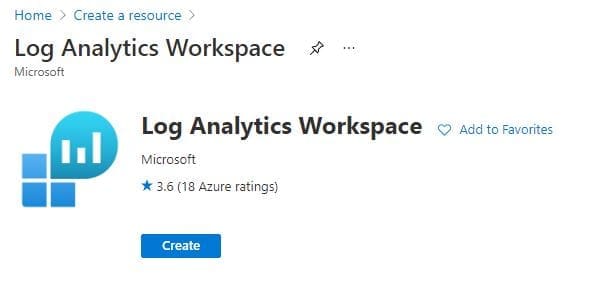
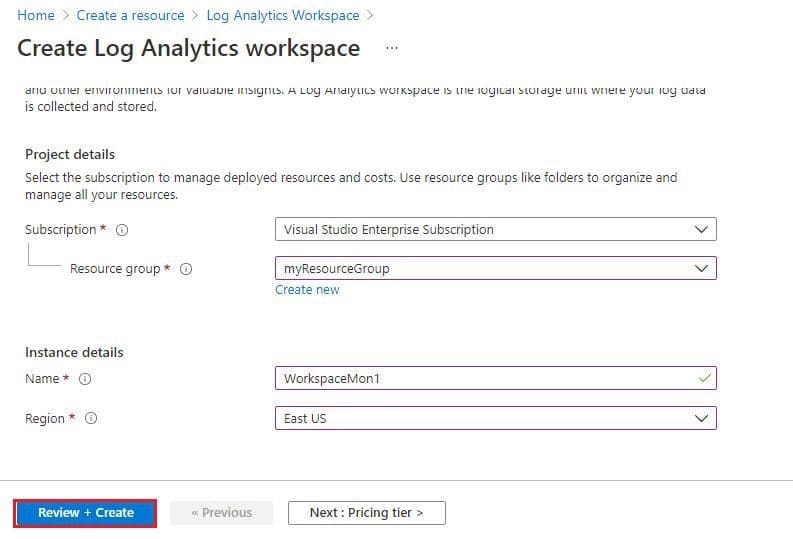
- Log in to the Azure portal, and create a Log Analytics Workspace in your Azure subscription:
- Click Create a resource
- In the search bar, search for log analytics
- Click Log Analytics Workspace
- Click Create
Then provide the following details below:
- A Subscription to link the workspace to
- A Resource group to host the workspace in
- A unique Name for the Log Analytics Workspace
- A Region to host the workspace in
- Click Review + Create once finished, then click Create. The Log Analytics Workspace will now begin deploying. A notification will appear in the top right of the portal.
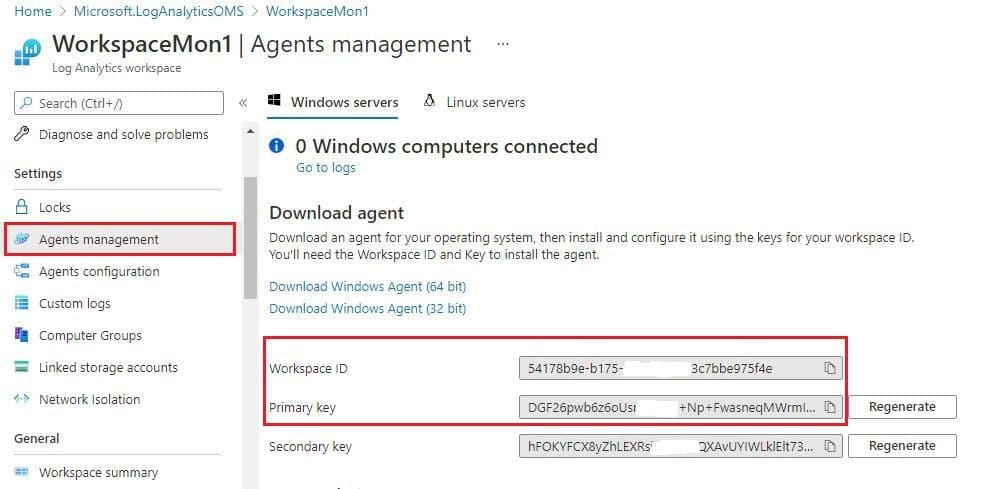
Once deployment is complete, navigate to the resource group you placed the Log Analytics Workspace in.
- Click the newly created workspace.
- On the new blade, under Settings, select Agents management.
- Note down the Workspace ID and Primary Key values.
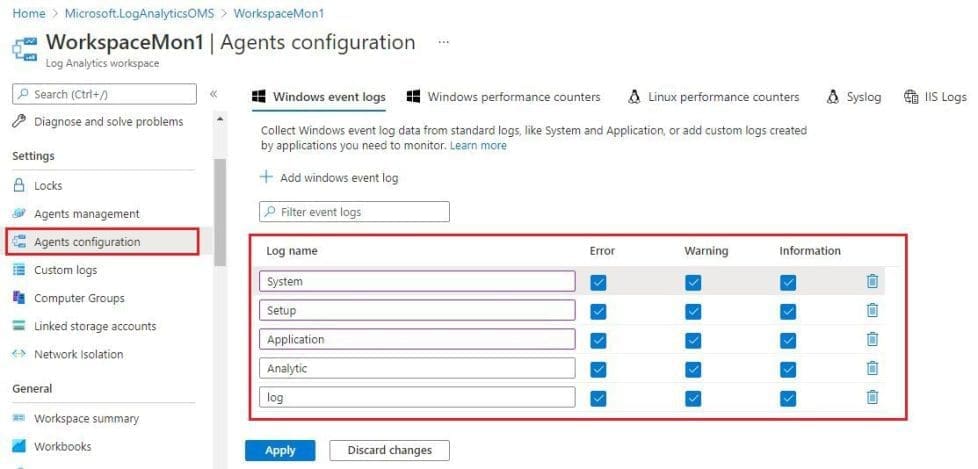
You can as well like to configure additional data sources just as it is shown below
- Under Settings, select Agents configuration.
- From the Windows event log tab
- Click Add windows event log
- Select an event log from the dropdown and use the checkboxes to determine the severities that you want to collect for this log type.
Please see the Benefits of Azure API Management and how to create an API instance. Learn Cost Management in Azure using the cost analysis tool: How to query a log that can analyze cost in Azure.
Installing the extensions
From the Azure portal. Select Virtual machines -> select a VM resource created on the list that you want to enable Azure Monitor on. Go to Settings, and select the Extensions blade.
Note: For any monitoring to work correctly, the VM must have HTTPS (port 443) enabled in the Network Security Group rules.
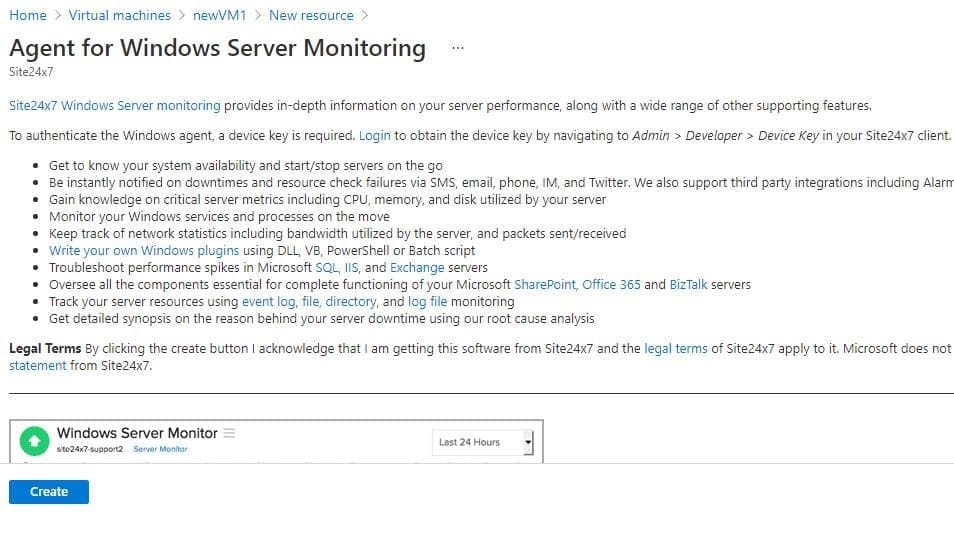
- Click Add at the top, select the extension Agent for Windows Server Monitoring, click Create and then OK, and wait for the deployment to finish before continuing.
- Provide the extension with the Workspace ID and Primary Key values (noted down previously), then click OK.
Configuring the Log Analytics Workspace
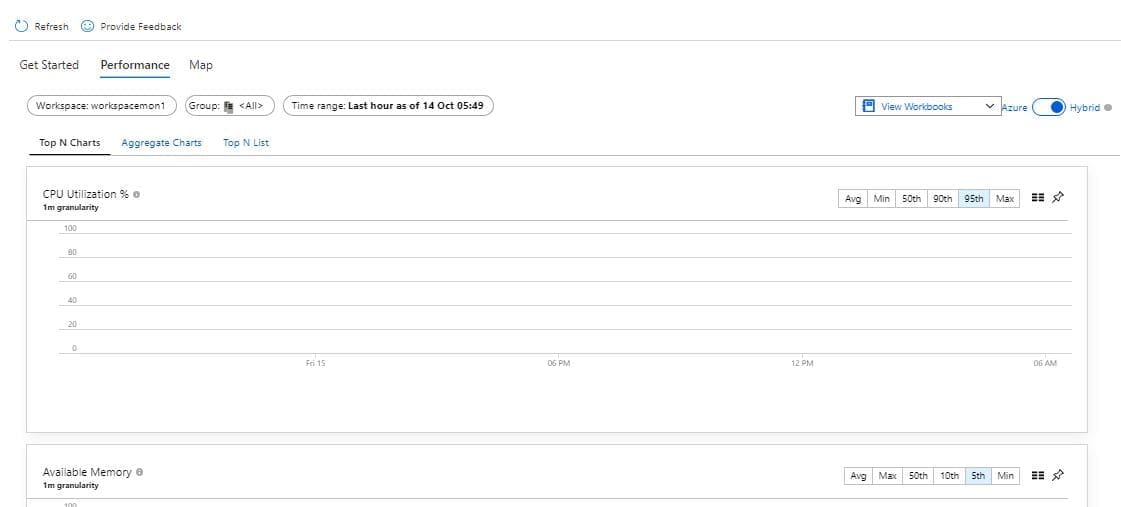
In public Azure, select Monitor from the favorites menu on the left. In the new blade under Insights, click Virtual Machines on the left.
You will see three usage analytics tabs (Get Started, Performance, and Map) for the VMs you have enabled Azure Monitor for VMs on.
- At the top, click the Performance tab, then on the right, move the switch from Azure to Hybrid
- A prompt will appear to upgrade the workspace, click Upgrade. In the new blade, click Upgrade again.
- Upon refreshing the page, the prompt will disappear and the workspace will begin showing usage analytics for the VMs you’ve enabled Azure Monitor for VMs on.
Note: It can take between 30 minutes and 6 hours for the dashboard to display updated data from Azure Monitor-enabled VMs.
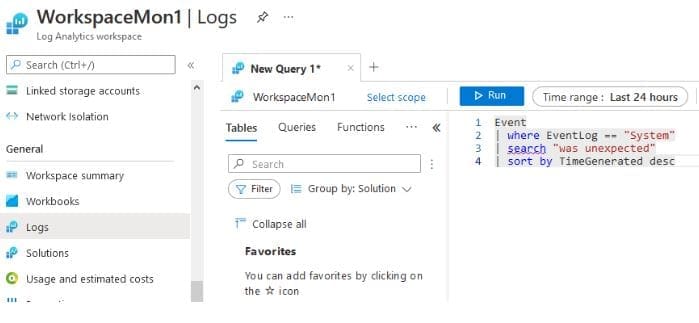
To Executing Kusto Query Language (KQL) queries to retrieve data from the Log Analytics Workspace
- Navigate to the Log Analytics Workspace you created.
- Under General, click Logs.
- Enter the KQL query in the New Query 1 tab, then click Run. The below example will select data from the event log table Event, filtering for events of type System and containing the phrase was unexpected, then sorted by the TimeGenerated field in descending order.
This article provided an overview of how to Configure Azure Monitor for VMs on Azure Stack Hub. it also discussed Azure Monitor for VM Insights, creating the Log Analytics Workspace, Installing the extensions, configuring the Log Analytics Workspace. I hope you found this article useful for your project.