
Windows Performance Toolkit is a performance monitoring tool that you can use to determine the general in-depth performance profiles of Windows operating systems. The Windows Performance Toolkit consists of tools like Windows Performance Recorder (WPR) and Windows Performance Analyzer (WPA). In this article, you will learn how to work with Windows Performance Toolkit. Please see How to check the version of Windows ADK, and how to correctly uninstall and upgrade Windows Assessment and Deployment Kit, Windows Preparation Environment, and Microsoft Deployment Toolkit.
The WPR records system events and the WPA analyze the events and create graph and data tables of event. The GPUView which is part of the Windows Performance Toolkit can be used to read any logged videos and kernel events and the data can be displayed graphically to users. Here is a video that demonstrates how to work with the Windows Performance Toolkit.
With GPUView developers and testers will know different events that might cause conditions like glitches, delays, and poor synchronization.
Windows Assessment and Deployment Kit
The Windows Assessment and Deployment Kit (ADK) was formerly referred to as Windows Automated Installation Kit. Windows ADK contains core assessment and deployment tools that IT Pros can use to deploy Windows 10 company-wide. You may want to learn about Performance and Diagnostics in Microsoft Cloud with Azure Monitor, and how Performance Monitor works in Windows 10.
Note: The Windows Performance Toolkit (WPT) is part of the Windows Assessment and Deployment Kit.
The WPT consists of performance monitoring tools that produce in-depth performance profiles of Windows operating systems and applications. This article discusses both Windows Performance Recorder (WPR) and Windows Performance Analyzer (WPA).
You may want to learn about “What Event Tracing for Windows is“, and What is ADK, MDT, Microsoft Endpoint Configuration Manager (SCCM), Intune, Autopilot, and WSUS.
Windows Performance Analyzer
The image below shows the Windows Performance Analyzer. We will be discussing the installation and usage as we progress through this guide.
You may also want to read about how to track your device performance and health via Windows Security in Windows 10. You can also read How to use Windows 11 PC Health Check App, and learn how to use the Reliability Monitor in Windows.
Follow the below steps to kick-start:Download the Windows Assessment and Deployment Kit
1: Download the Windows Assessment and Deployment Kit (Windows ADK) from Microsoft for your version of Windows. I will be downloading Windows ADK for Windows 10.
2. Run the downloaded adksetup.exe file.
3. You may decide to select to install on the current system or another system. But I will be installing it on the current system path.

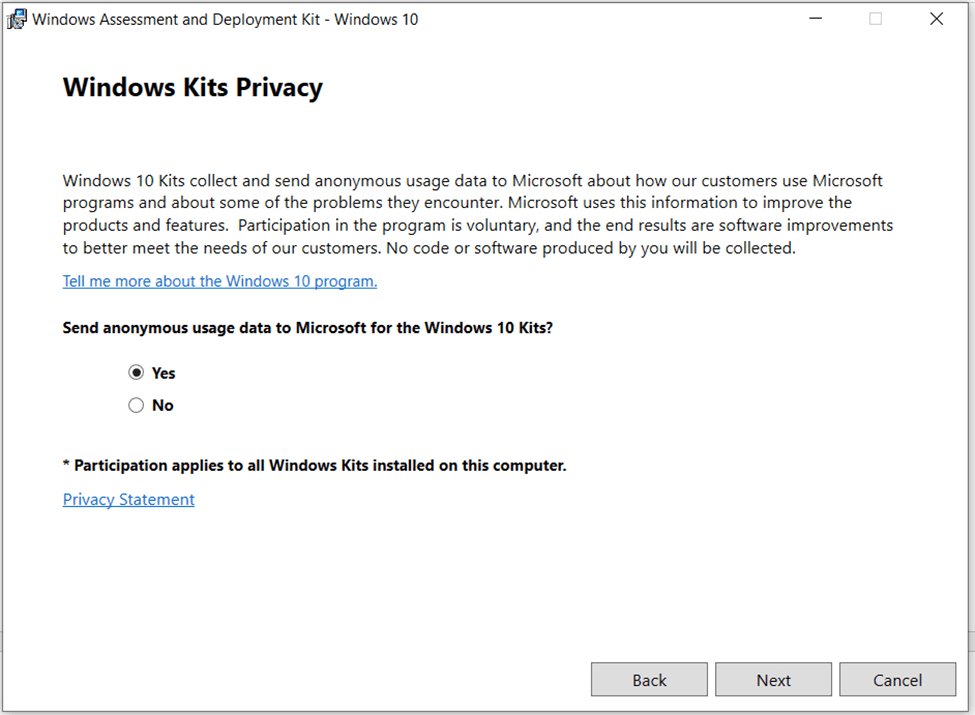
4. Select Yes or No to send anonymous data to Microsoft for the Windows 10 Kits installed on the system.
5. Uncheck all but Check only the Windows Performance Toolkit and click install.

6. Wait for the Installation to finish.

7. After successful installation click close.

8. If you check your start menu you will find the Windows Performance Recorder, GPUView, and Windows Performance Analyzer listed

9. When you click the Performance Monitor you will see the below image

Performance Recorder
10. Click the Performance Recorder records all current performance statuses on your system and save afterward.

Upon starting, you can click on save as shown below.

11. Then use the Performance Analyzer to analyze the Performance recorded data that was saved. Click the Open in WPA

12. Immediately the Windows Performance Analyzer will open and you can analyze the results of the recording.

I hope you found this blog post how to Work with Windows Performance Toolkit interesting and helpful. If you have any questions do not hesitate to ask in the comment section.


