Install and conduct performance testing using Apache JMeter on your Web App

JMeter is an Open Source Java application designed to measure performance and load test applications. Apache JMeter can measure performance and load test static and dynamic web applications. It can be used to simulate a heavy load on a server, group of servers, network or object to test its strength or to analyze overall performance under different load types. In this article, we will discuss “how to Install and conduct performance testing using Apache JMeter on your Web App”. Please see How to work with Windows Performance Toolkit, How to install Java Runtime Environment on Mac OS, and How to Install Apache HTTP Server on Ubuntu 20.04 LTS.
We have the JMeter GUI mode and Non-GUI mode, while the GUI mode is better for adding and editing new configuration elements, thread groups, and samplers but it consumes a lot of memory and resources when it runs a recorded script. The Non-GUI mode is highly recommended as a test execution mode in JMeter for those that do not have a high-capacity system that can withstand the GUI mode. JMeter consumes less memory and can accommodate more threads on a load generator.
Install JMeter to Conduct Performance Testing
JMeter requires Java to work on your system. You may want to know the Difference between testing and debugging and you may want to read more on other configuration settings you can read these: Configuration Manager Tools: How to install and debug logs with the CMTrace Tool, How to install and configure Ansible on Azure Virtual Machine, Keepalive Settings: Understanding keepalive configuration, Installation and configuration of Cockpit on CentOS Linux and you may want to learn How to Perform Load Test on Mobile App using Apache JMeter installed on your Windows System
Follow these steps to install JMeter: If you want to know the current Java version on your system try this command:
java --versionDownload Java here!
2. After installing Java then go ahead to download JMeter here. Go to the binary section and download the zip file and extract the file.
3. Now click on the jmeter.bat file
Immediately this will launch the JMeter screen
The home screen is divided into two sections, the left section is all about the elements of the test plan and the right section is where you add the configuration of the elements.
4. Rename the Test Plan to any name of your choice but in this article, I will name it NBA and click on the Save icon.
5. Now add a thread group. Right-click on the Test Plan and select Add > Threads (Users) > Thread Group. Thread groups are users that will be needed during this test.
6. Give the Thread Group a name and set the Thread Properties
Configure JMeter
7. Next Configure the Request that JMeter can work on. I will first select HTTP Request the simplest for now. Right-click the Thread Group you created and select Add > Sampler > HTTP Request.
8. Give the HTTP Request a name and add the server name or IP. There is no need of adding HTTPS or HTTP as it will be routed through the correct protocol. In the Path add a forward ‘/’ since we are going to access the route pages.
9. Let’s Perform an HTTP test now since we have set up all these. But we still need to add some more test elements and to do this right-click the Thread Group select Add > Listener > [View Results Tree] [View Results in Table]
Run Performace Test
10. Now Save and Run the Test. Check your result from the View Results Tree and View Results in Table. You can always go back to the Thread Group to change Thread Properties.
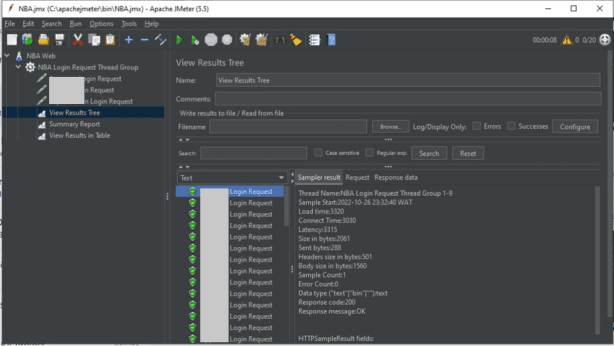
11. Let us assume we have an account Super Admin setup the below image shows I was able to log-in successfully. The Response code is 200 and OK.
The below shows the successful login token
The image below shows the Request body
The Summary report for the Login process for all the users shows 0.00% error
We will now be increasing the load on the Login. But if we will be Simulating multi-users then we will not be using the GUI mode rather we will use the command prompt. Remember that on the opening screen when launching JMeter state that :
Don't use GUI mode for load testing !, only for Test creation and Test debugging. For load testing, use CLI Mode (was NON-GUI):Let’s simulate 60 users making a total 60 samples. The result returns with 0.00% error and Status 200 which is OK.
We are still having status 200 for the 60 samples
Simulate using the Non-GUI Command
Next, i will be using a Non GUI-like command prompt as I will be simulating more loads by simulating 300 users.
Run this command:
jmeter -n -t <test JMX file> -l <test log file>jmeter -n -t C:\apachejmeter\bin\NBA.jmx -l C:\apachejmeter\bin\Report\NBA.csvI will change the directory to the bin folder of my JMeter installation file and run the command there. Then I will state the name of the CSV file which will be used to capture the log like a report.
The test returns successfully. Go into the Bin folder and open the CSV file.
Below is the CSV file that captures the log of the simulation and you will know the status of the application performance.
I hope you found this blog post on how to install and conduct performance testing using Apache JMeter on your Web App Interesting and helpful. In case you have any questions do not hesitate to ask in the comment section.


