Monitoring services using Zabbix

For critical production servers and services, monitoring is very critical. One is to get notified about issues immediately and the second is to resolve quickly hence not affecting SLA. Here, I will be showing you the steps employed in monitoring services using Zabbix, a basic Zabbix template, and very easy Linux commands. Please see PC Health Check: How to Use Windows 11 App, Performance and Diagnostics in Microsoft Cloud with Azure Monitor, and How to check Hard Drive Health (SMART) in Windows.
The traditional way of monitoring services is by monitoring the ports associated with the services, however, in some cases/environments, critical services have to be monitored E.g. (squid). Hence in this post, you will see how to monitor services using service names and not ports on Linux servers.
Some other guides can be found in these links: Practical use of SELinux in production: How to locate directory file context and restore it ,how-to-create-a-static-pod-in-kubernetes-with-demos-that-can-help-you-become-a-better-Kubernetes-administrator, and how to create-and-deliver-a-report-on-system-utilization-on-a-Linux-based-os/.
Note: Moreover, You should already have the Zabbix monitoring tool installed in your environment to do this.
Service Check
First, check the services running
systemctl | grep running 
Take note of whatever service name you will want to monitor, Log in to your Zabbix console and create a new template and application.
Configuration -> Templates -> Create template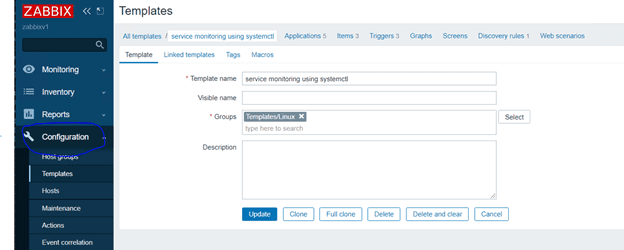
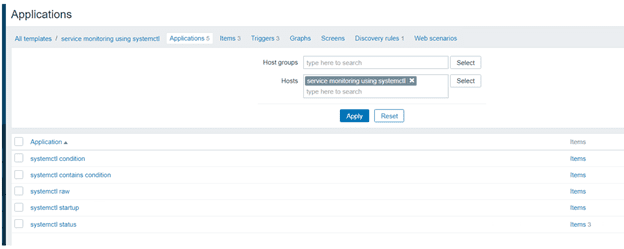
Create New application on Zabbix console – > systemctl status
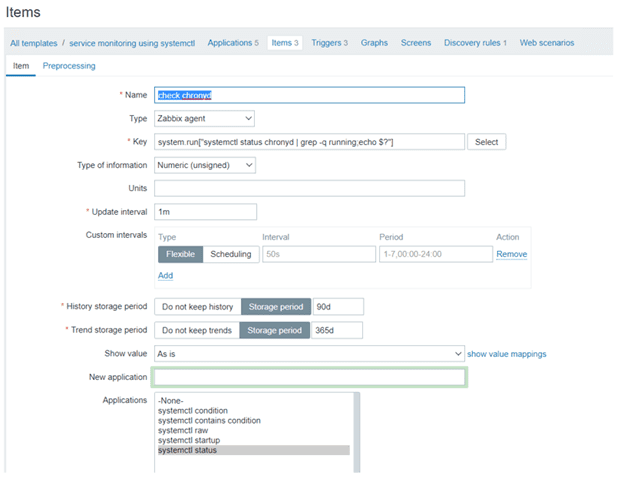
Furthermore, Create an item for whatever service name you want to monitor

Here is a guide on how to install Zabbix Monitoring Tool on a Linux System, and how-to-use-container-insights-to-get-the-full-benefits-of-azure-monitor-for-azure-Kubernetes-workload.
Create Alert
Create individual Alert triggers
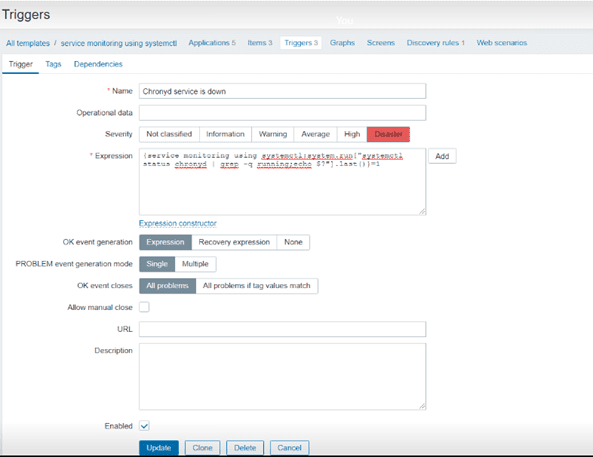
Trigger expression
{service monitoring using systemctl:system.run["systemctl status chronyd | grep -q running;echo $?"].last()}=1Please change the service name in the expression to your configured service name.
Once Items and triggers have been created on the services needed. Test or simulate the new configurations by stopping services.

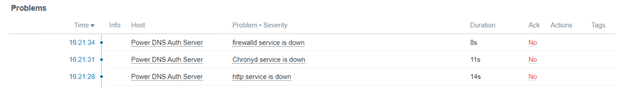
Now check Zabbix console
I hope you found his article useful on Monitoring services using Zabbix. Please feel free to leave a comment below.


image not showing clearly
In the future, we will improve, thank you for pointing this out.
Hello, I’ve configured this but it’s not triggering the alert. Do i need to open a port from the zabbix server to the host?
I added the item but got an Unsupported item key error.
Did you add AllowKey=system.run[*] in the agent configuration file ?
Thanks it works for me with a zabbix version 5.4.9.
But I had to change the format of the trigger because of that version :
last(/Template_name/system.run[“systemctl status service_name | grep -q running; echo $?”])=1
And in requirements I had to add “AllowKey=system.run[*]” in the agent configuration file.
Thank you so much for your input.
Hi, can u please type the entire code?
For my case, i wrote this code for the trigger:
last(/WePacsLinux/system.run[“systemctl status orthanc | grep -q running; echo $?”])=11
and for the item:
system.run[systemctl status orthanc | grep -q running; echo $?]
but it gives me this error:
incorrect trigger expression starting from “last(/WePacsLinux/system.run[“systemctl status orthanc | grep -q running; echo $?”])=1”.
Not working with quotes on Zabbix Server 5.4.3.
For me item began to work (cron.service, for example) with this code:
Thank you very much for sharing your solution!
Hi ..It is not possible through SNMP. Do you have any expression throgh snmp .
net.tcp.service[service_name] it working for some service . Not for all service.
Thanks
can you please describe the total steps and commands briefly ? As it is not working