
Zabbix is an efficient monitoring tool for servers, apps, and network devices that is free and open source. It collects system metrics using agents. It also monitors typical services like SMTP and HTTP, and it enables host monitoring using SNMP, TCP, and ICMP checks. Zabbix aims to monitor thousands of servers, virtual machines, and network devices in real-time. You can access other useful and similar Linux and windows guides from this link: How to Install MongoDB on a Linux System and How to Set Up Flutter with Android Studio on Linux and how to Set Up Flutter with Android Studio on Linux.
It stores data in a MySQL/MariaDB database and allows encrypted communication between the server and linked clients. This guide will walk you through the process of installing the Zabbix monitoring tool on a Linux system, Ubuntu 20.04 or higher.
Other guides can be referenced here: Create multiple users and set passwords for each in Ubuntu Linux, how to add WhatsApp UWP on Windows 11, how to install and configure Elasticsearch on Linux, and how to Install Apache HTTP Server on Ubuntu 20.04 LTS. Lastly, here is a guide on how to monitor services using Zabbix.
Prerequisites to install Zabbix Monitoring Tool
This is similar with choosing the right platform. For the purpose of this guide, we shall be using Ubuntu 20.04 but the same method will work for 22.04. You would also need a user account with Sudo privileges.
Also, see how to install Gradle on Ubuntu and how to Install Docker Portainer on Linux and how to install AnyDesk on a Linux Machine.
Install Zabbix in Linux Server
Follow the steps below to install and configure Zabbix.
Step1: Install LAMP Server
To begin, use the following command to install Apache, MariaDB, PHP, and any other needed extensions:
apt-get install apache2 libapache2-mod-php mariadb-server php php-mbstring php-gd php-xml php-bcmath php-ldap php-mysql unzip curl gnupg2 -y
When you’ve installed all the packages, modify the php.ini file as follows:
vim /etc/php/7.4/apache2/php.iniAdd the following settings to your text editor
memory_limit 256M
upload_max_filesize 16M
post_max_size 16M
max_execution_time 300
max_input_time 300
max_input_vars 10000
date.timezone = Africa/Lagos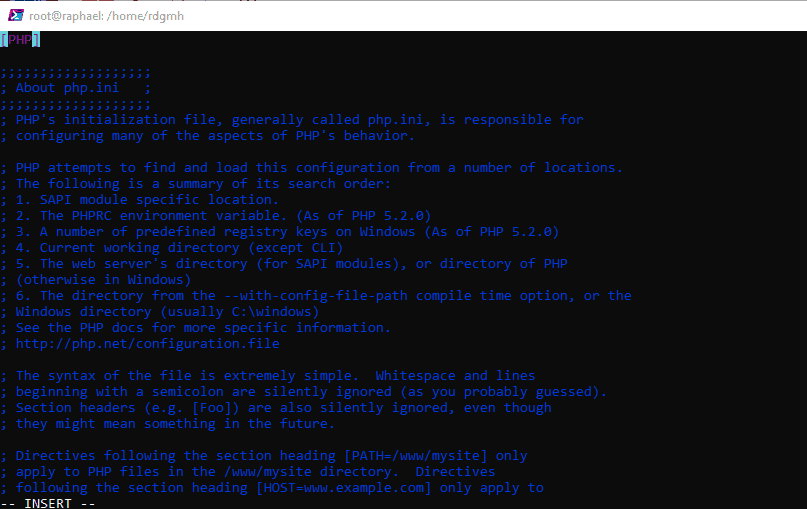
Save and close the file then restart the Apache service to apply the changes:
systemctl restart apache2Step 2: Create a Database for Zabbix Monitoring
The next step is to create a Zabbix database and user. To begin, use the following command to log into the MariaDB shell:
mysql
Once logged in, run the following command to setup a database and user:
CREATE DATABASE zabbixdb character set utf8 collate utf8_bin;
CREATE USER 'zabbixuser'@'localhost' IDENTIFIED BY 'password';
Next, use the following command to grant all access to zabbixdb:
GRANT ALL PRIVILEGES ON zabbixdb.* TO 'zabbixuser'@'localhost' WITH GRANT OPTION;Next, use the following command to flush the privileges and quit the MariaDB shell:
FLUSH PRIVILEGES;
EXIT;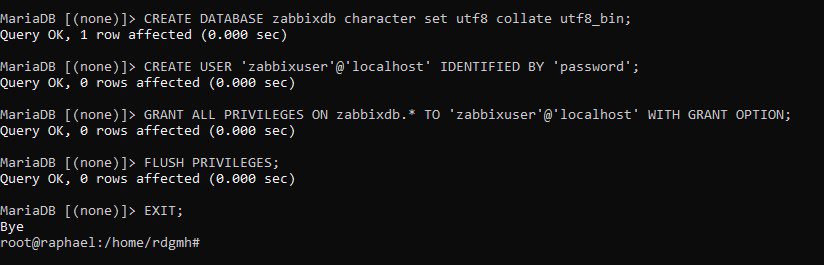
Step 3: Install and Configure Zabbix Monitoring Tool
Zabbix is not installed by default in the Ubuntu 20.04 standard repository. As a result, you must install the Zabbix repository on your machine. You may use the following command to install it:
wget https://repo.zabbix.com/zabbix/5.0/ubuntu/pool/main/z/zabbix-release/zabbix-release_5.0-1+focal_all.deb
dpkg -i zabbix-release_5.0-1+focal_all.deb
Then, use the following command to update the repository and install the Zabbix server:
apt-get update -y
apt-get install zabbix-server-mysql zabbix-frontend-php zabbix-agent zabbix-apache-conf -y
Once you’ve installed all the packages, use the following command to start the Zabbix service and set it to start on system reboot:
systemctl start zabbix-server
systemctl enable zabbix-server
The Zabbix database schema must then be imported. You may import it by using the following command; keep in mind that you will be required for the MySQL password you generated before.
cd /usr/share/doc/zabbix-server-mysql
zcat create.sql.gz | mysql -u zabbixuser -p zabbixdb
Please keep in mind that the zcat command might take several minutes to finish.
Then, update the Zabbix default configuration file to provide the database settings:
vim /etc/zabbix/zabbix_server.conf
Modify the following lines:
 DBHost=localhost
  DBName=zabbixdb
  DBUser=zabbixuser
  DBPassword=password
Please keep in mind that the zcat command might take several minutes to finish. Also, You will need to uncomment # DBHost and DBPassword
Then, update the server with the command
systemctl restart zabbix-server
systemctl restart apache2
Step 4 – Configure Zabbix Agent
You will also need to configure the Zabbix agent on your system. You may configure it by modifying the file zabbix agentd.conf:
vim /etc/zabbix/zabbix_agentd.conf
Modify the following lines:
Server = 127.0.0.1
ServerActive = 127.0.0.1
Hostname = Zabbix Server
Save and close the file before starting the Zabbix agent service and enabling it to start at boot using the following command:
systemctl start zabbix-agent
systemctl enable zabbix-agent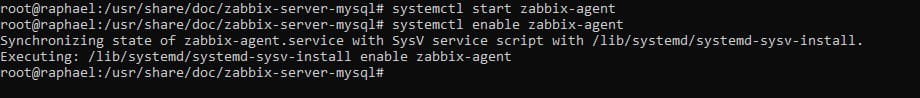
Step 5: Access Zabbix Dashboard
Launch your internet browser and navigate to the Zabbix dashboard. You’ll be sent to the Zabbix welcome page:

Tap the Next step option. You should be sent to the following page:

After ensuring that all the essential PHP extensions are installed, click the Next step button. Please visit the following page:

Enter your database information and then click the Next step button. You should look at this page:

Enter your Zabbix server information and click the Next step button.

Confirm all settings by clicking the Next step button. When the installation is finished, you should see the following page:

Finish by clicking the Finish button. You’ll be sent to the Zabbix login page:

Enter the default username, Admin, and password, Zabbix, and then click the Sign-in button. The Zabbix dashboard should be visible on the following page:

Summary
Kudos! you have successfully installed and configured the Zabbix monitoring tool on a Linux system. Zabbix agents may now be installed on additional client systems and monitored from the Zabbix dashboard.
I hope you found this article on “how to install zabbix monitoring tool on a Linux system” very useful. Please feel free to leave a comment below.


