
Checkmk is a leading IT monitoring system for on-premises and cloud infrastructure and application monitoring. In this tutorial, I will show you how to install Checkmk on an Ubuntu server and how to add a first host to the monitoring. Checkmk also runs on other Linux distributions such as Debian, RHEL, CentOS or SLES, and in a Docker container or as a virtual appliance. You can download the latest Checkmk version for all platforms from the official Checkmk website. In this article, you will learn how to perform system monitoring with Checkmk. Please refer to these related guides: How to check if MBAM is installed on Windows, Useful Tutorial on CBackup Software, How to detect who disabled a user in Active Directory, DriveLock Error: The push installation of the agent failed, and Veeam Agent Vulnerability: Fix Veeam Agent vulnerability for Microsoft Windows.
You can use CheckMK for free: I will use the Checkmk Free Edition, which has all the features of the CheckMK Enterprise Editions, but is limited to one site, with 25 hosts –enough for a small monitoring environment. As an alternative, you can also use the Checkmk Raw Edition, which is completely open-source and does not limit the number of hosts.
CheckMK Prerequisites
This tutorial does not require any monitoring experience and you will see that is fairly easy to get started. Checkmk also provides pre-configured thresholds for alerts and warnings, so that you do not have to waste time configuring these yourself – and of course, you are able to customize these as required. Your Ubuntu server has to be at least version 16.04 or higher. I used an Ubuntu server running on version 20.04 with 4 CPU cores and 8 GB RAM, which is more than enough for a small monitoring environment. For this tutorial, you also need a client to download Checkmk and send the package to your host server. The client must also have root access to your monitoring host server.
Step 1: Download Checkmk Package
- Follow the link to the download section on the Checkmk website.
- Select the Checkmk version of your choice. As mentioned, I went for the CheckMK Free Edition, select the latest stable version (this tutorial is based on version 2.0.0p9), choose your platform and your OS version. Click the download button and download the package.
- Now you have to send the file to the server you want to host the monitoring on. I use
the scp command. In this tutorial the IP address for the Ubuntu server is 10.0.3.15
scp check-mk-free-2.0.0p9_0.focal_amd64.deb root@10.0.3.15:/tmp
- Once the package has been sent to the host server for the monitoring, all further
actions will be performed there. Log in as root using the command ssh.
ssh root@10.0.3.15Step 2: Install the Checkmk package on your host server
Install the package including all of its dependencies, I used apt install. Please note that you should add the file path to the .deb file following apt install.
apt install /tmp/check-mk-free-2.0.0p9_0.focal_amd64.deb
Once the installation has been completed, you can perform a test. The command omd should be
accessible now.
omd version

A little bit of history here: omd is short for Open Monitoring Distribution and this is an open-source project created by Mathias Kettner, the founder of Checkmk. It revolves around the efficient and flexible installation of a monitoring solution assembled from various components.
Step 3: Create a first Checkmk monitoring site
The next step is to start an initial monitoring site (a site is an instance). Make sure you are still root and use omd create to create a new Checkmk site and name it as you wish. This tutorial went for ʻcheckmk_TDA’
omd create checkmk_TDA

You should now see the information about how to start and access your Checkmk site on your screen. I did not change your admin password right now on the terminal but will do that in Checkmk user interface in the next step. So, for now, copy the randomly generated password (you will need it in the next step) and start your Checkmk monitoring site with omd start.
omd start checkmk_TDA

If you want to drill deeper into Checkmk later on (you should), it is important to understand what has just taken place. You have created a new user, which is known as the site user, and a group with the name of the site on your server. A directory for the site will have been created under /omd/sites, (e.g. /omd/sites/checkmk_TDA). Checkmk also copied its default configuration into the new directory and a user with the name ʻcmkadminʻ has been created for the Checkmk web interface.
Step 4: Change your password and start to configure your monitoring
Access the Checkmk user interface via your browser. Every Checkmk site has its own URL that is composed of the IP address or hostname of your monitoring server and the name of the Checkmk site. In my example this would be ‘10.0.3.15/checkmk_TDA’ .
- Open the link to your Checkmk site in your browser. You can open the link shown on your terminal. Enter with the user ‘cmkadmin’ and use the password you copied from the terminal before. The main dashboard of Checkmk looks empty because you did not add a host to the monitoring yet.
- Go to ʻUserʼ in the sidebar on the left and click on ʻChange passwordʼ under ʻProfileʼ. Here you can change your password (recommended).
As the first host, you should always add the server you are hosting your monitoring on. Checkmk supports several ways of monitoring servers, and the best method for server monitoring is usually by using the Checkmk agents.
Download and install the agent
Before adding a server, you will need to install the agent. In the sidebar on the left, you find a button with a gearwheel named Setup. This is the control panel where all of the configurations are performed, and you will also find the monitoring agents there.
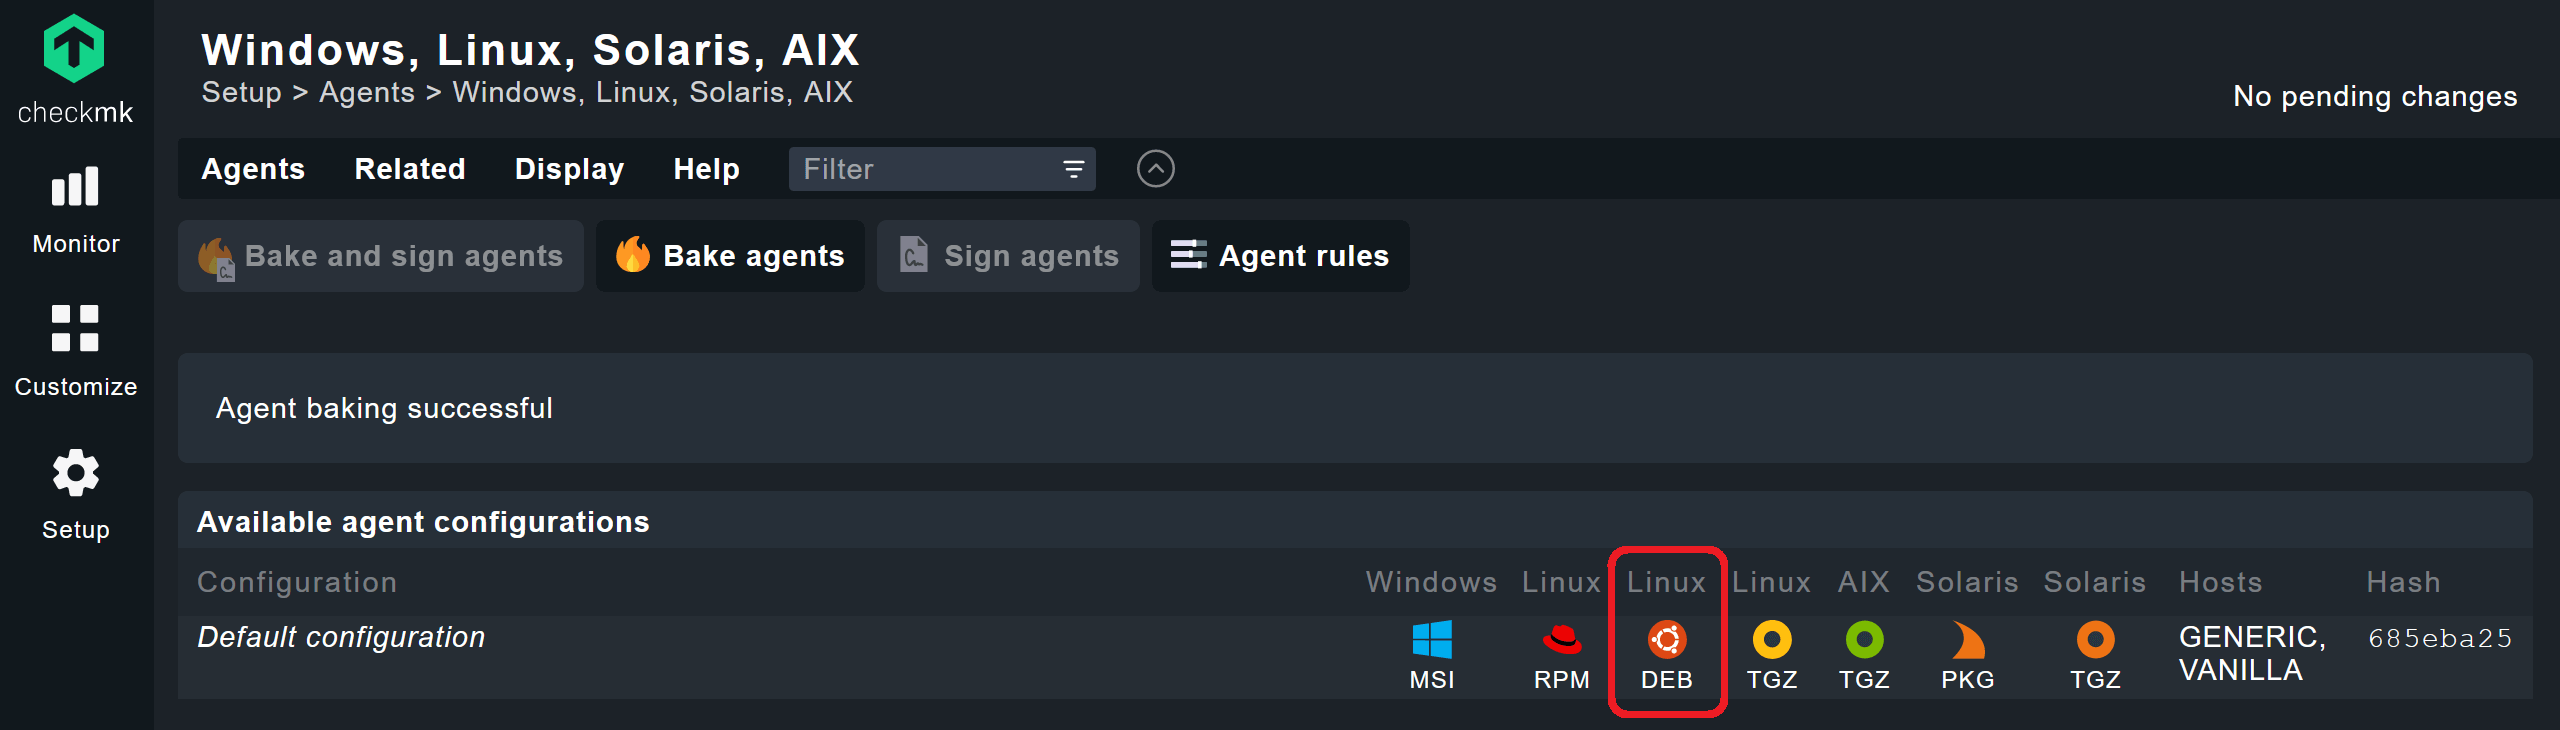
- Click on Setup > Agents > Windows, Linux, Solaris, AIX
- Select the package for your operating system to download it.
- Copy and install the agent on your monitoring host. For my Ubuntu server, I downloaded the .deb package and installed it on the server like any other package.
After the agent has been installed, go to Setup > Hosts and then click on ʻAdd hostʼ. Add the name of your server under Hostname. If you have DNS set up in your network, Checkmk can resolve the IP address for your hostname automatically.
Otherwise, add the IP address by clicking the checkbox next to IPv4 Address, and then entering it there. If you add an IP address, you can choose any hostname you like. Leave the other areas unchanged.
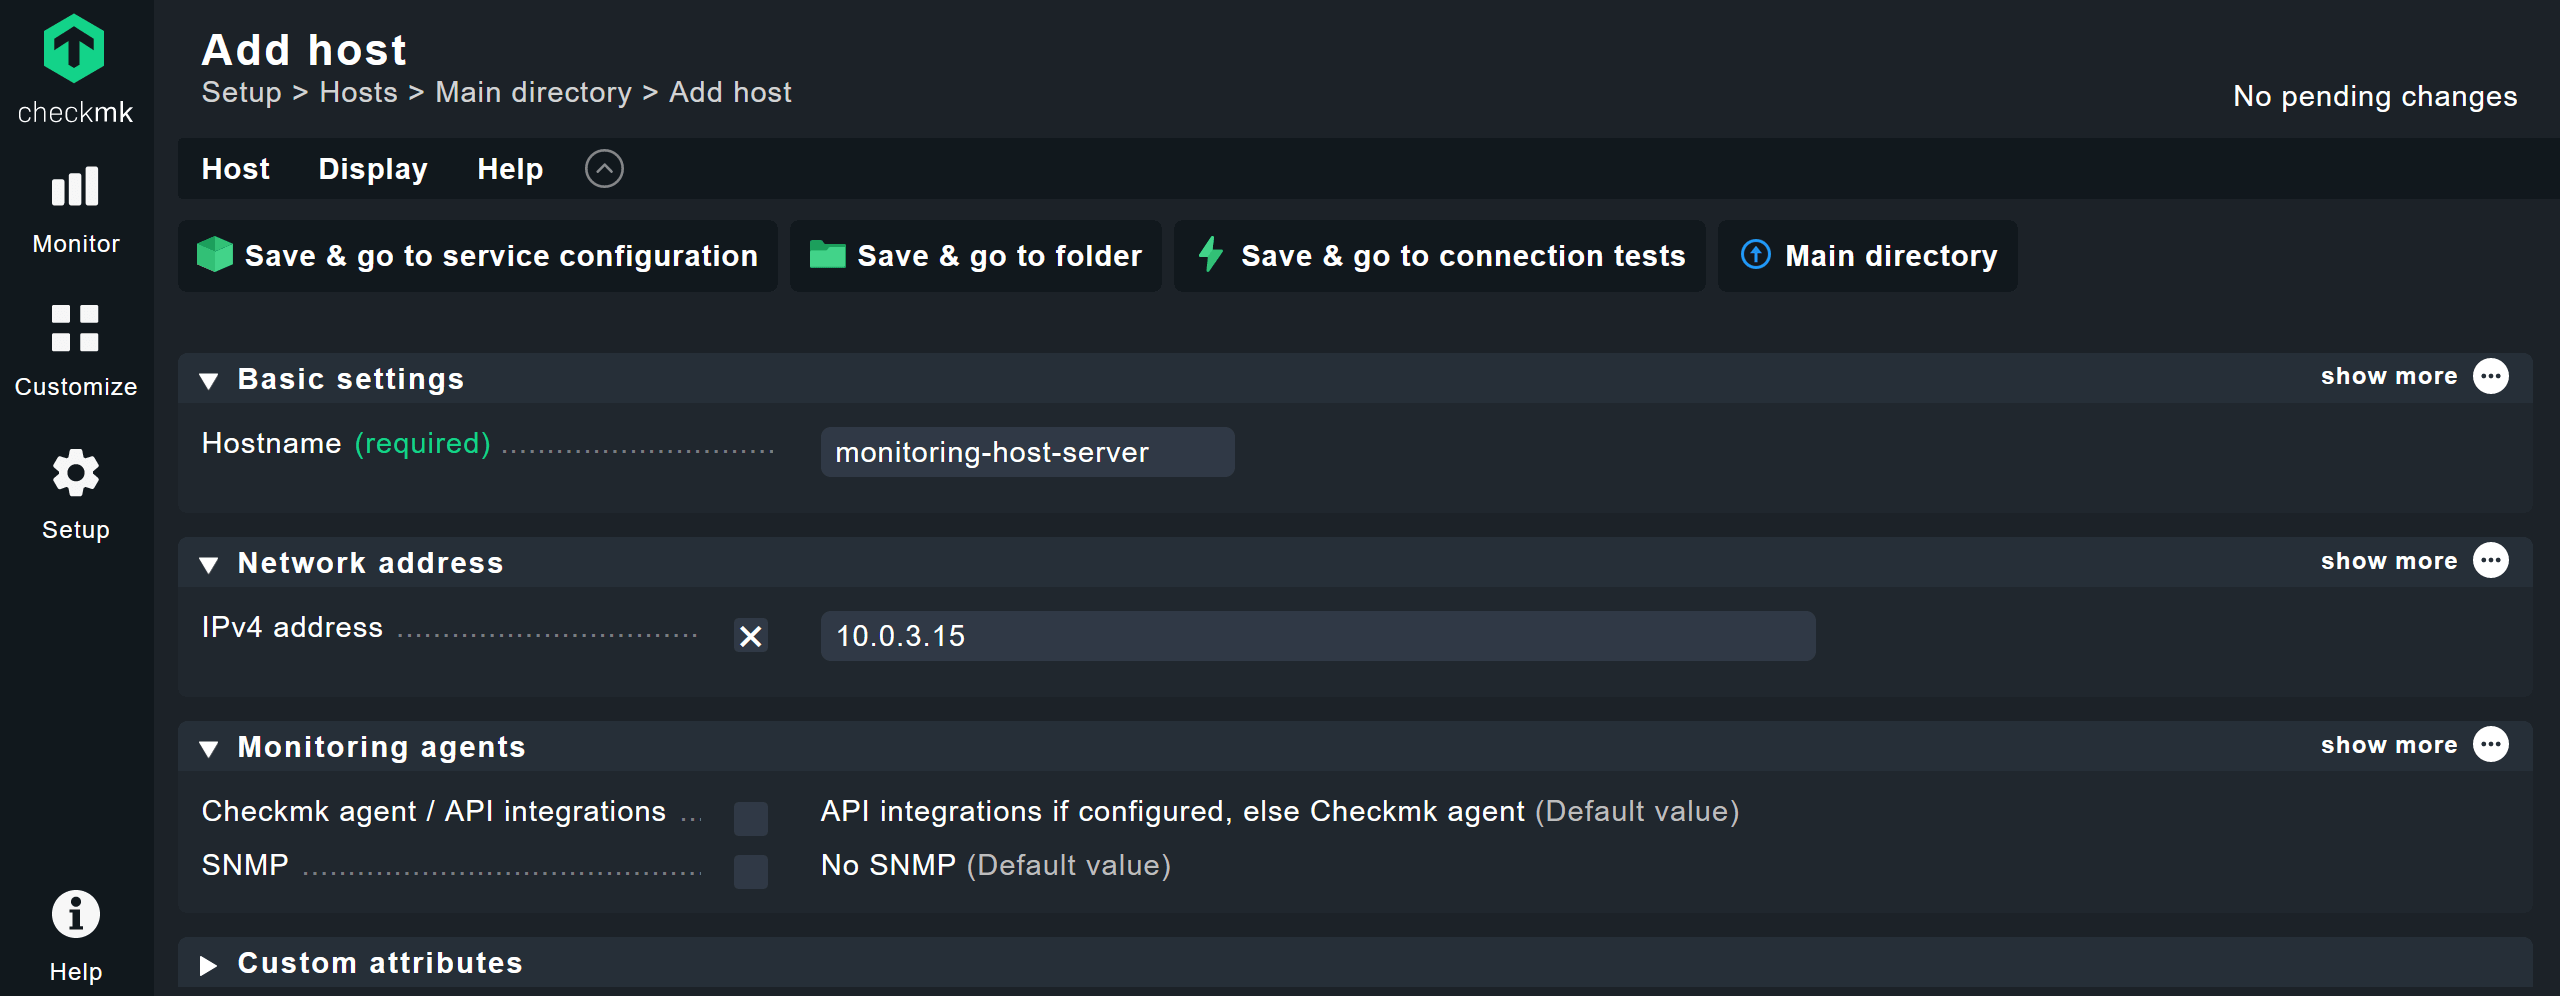
Save & go to service configuration
When you are done, click on ʻSave & go to service configuration’. Checkmk will now automatically discover any relevant monitoring services on that host, and you should then see a list of Undecided services. Checkmk will also automatically add labels depending on the type of device, these will help you to organize your hosts in the future.
Click on ʻFix allʼ to monitor all of these. That will add all of the detected services and host labels to the monitoring and will also remove services that have ʻvanishedʼ. You can manage the services manually, of course, but the Fix all function makes it a lot easier.

As the last step, you need to activate the changes by clicking on the highlighted field with the yellow ʻ!ʼ at the top right corner that counts the number of changes. Click on ʻActivate on selected sitesʼ and you will have successfully added the first server to your monitoring.
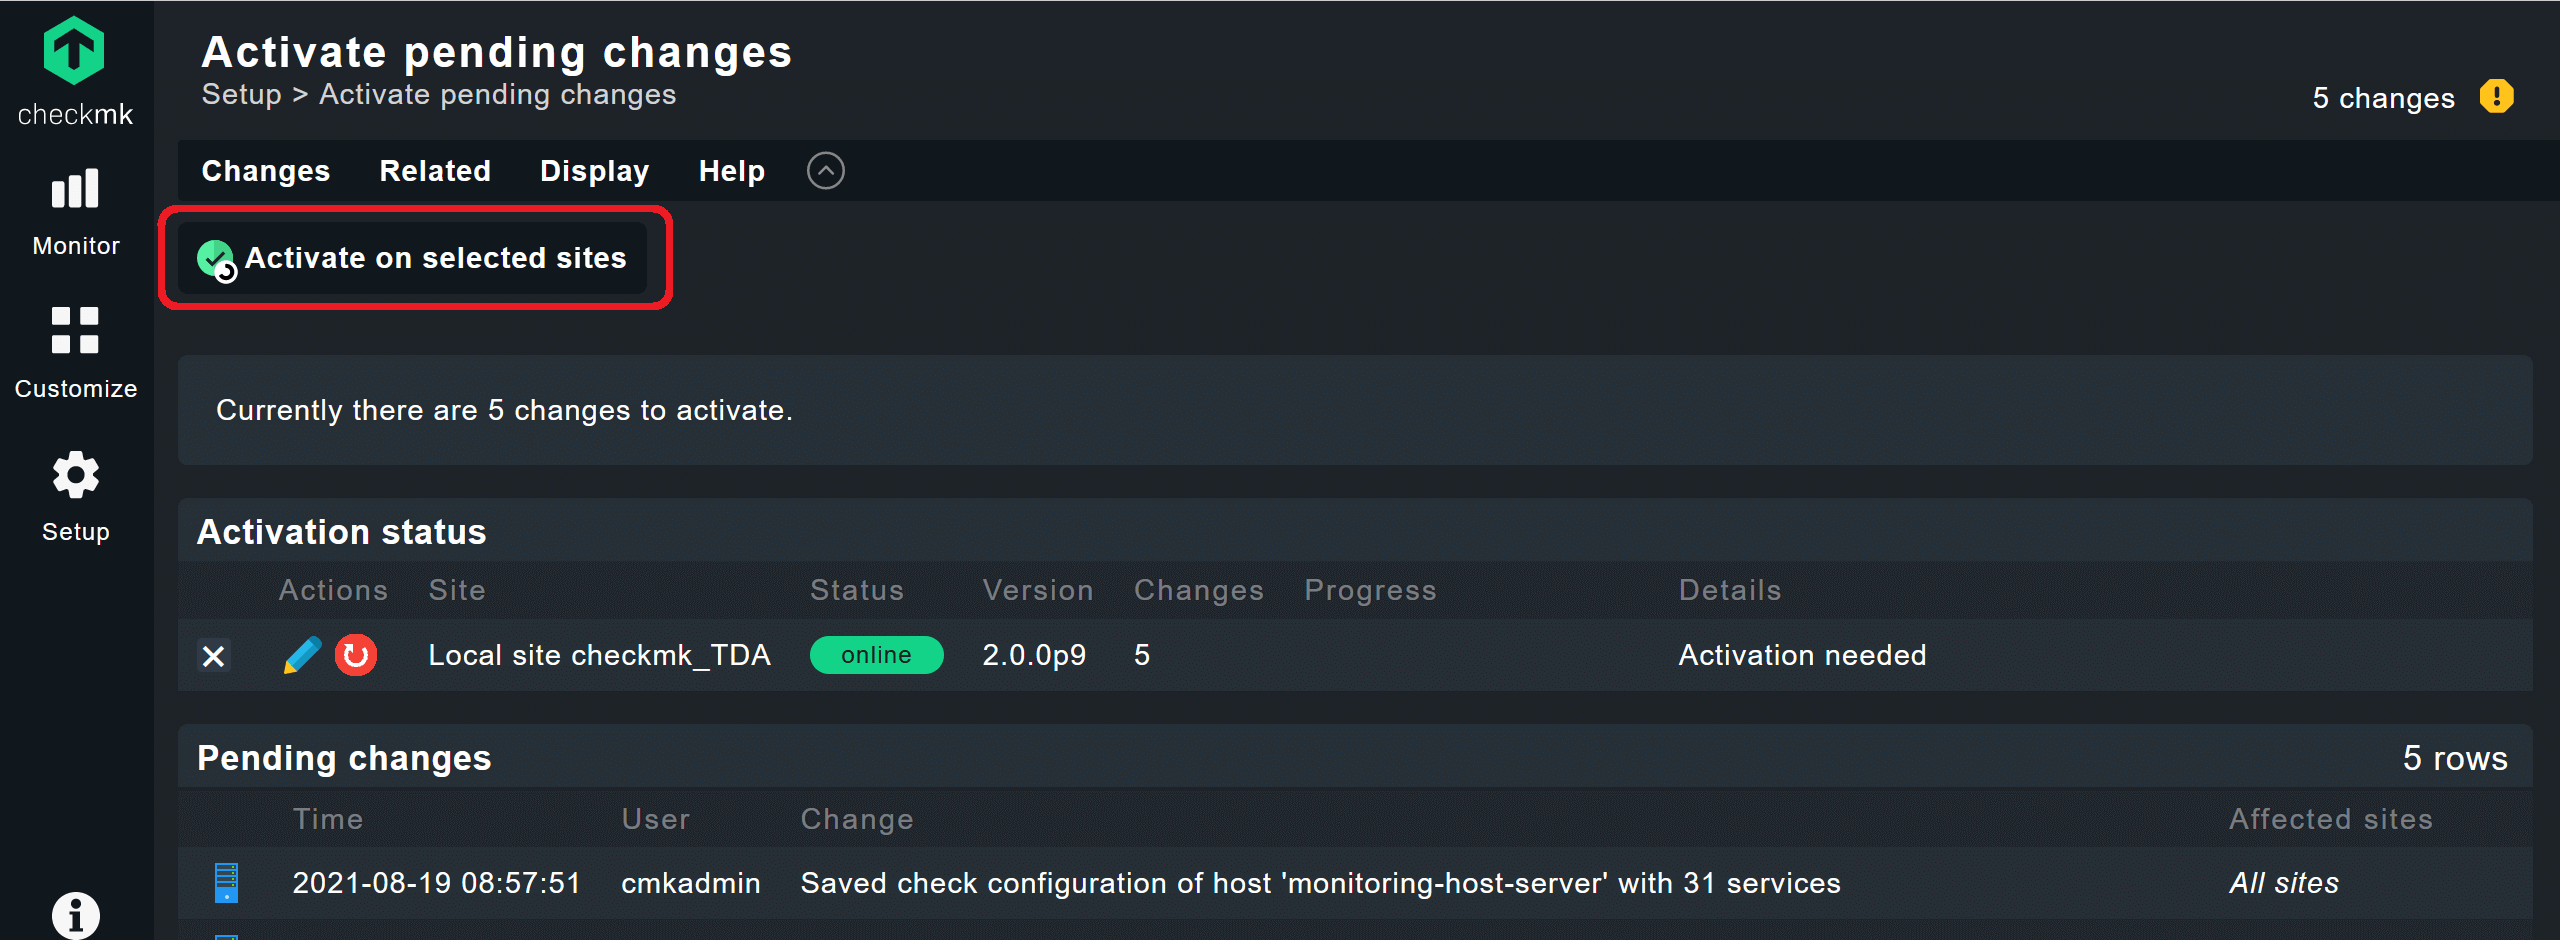
Why do you need to do that? It is a safety mechanism. Changes made to the monitoring will be listed under ʻPending changesʼ. You can review any changes before they affect your monitoring. Checkmk differentiates between the Setup as a configuration environment, in which you manage the hosts, services, and settings, and the area called Monitor, in which the actual operational monitoring takes place. New hosts and other changes in the configuration initially have no effect on the monitoring. You need to activate these before they go into production.
Step 5: System Monitoring with CheckMK
This tutorial ends here, but your real monitoring experience has only just started. You have a monitoring site up and running, and also added the first host. You saw that there are many more agents, so you can just go ahead and add more hosts. The procedure is similar to other systems.
Checkmk supports most monitoring use cases out of the box thanks to its almost 2,000 available official monitoring plug-ins. If you want to monitor a network device via SNMP, for example, just tick the box when adding the host and switch the default from “no SNMP” to your SNMP version, you will see that network monitoring is also easy with Checkmk. Have a look at the Checkmk handbook, as well as in the official Checkmk forum, in which you find an answer to almost any question.

I hope you found this blog post helpful on how to perform system monitoring with Checkmk. If you have any questions, please let me know in the comment session.


